One of the long standing debates in tax policy is that between advocates of income and consumption taxes. As the Government prepares for its Tax White Paper, we’re about to go once more round the mulberry bush! The argument has already been made by former Treasury Secretary Martin Parkinson that if we increased the GST and cut income tax, Australia’s economic growth prospects would improve. This article summarises the issues and looks at the research evidence in favour of each of these tax bases.
Income and consumption taxes: what’s the difference?
Before we begin, it’s worth making clear the difference between income and consumption taxes. We’re all familiar with the personal income tax on wages, but income taxes also apply to investment income (capital gains, interest and dividends) and to companies and other entities as well as individuals. An income tax taxes increases in a person’s spending power from year to year, whether this comes from wages or an increase in the value of their investment assets (e.g. property or shares).
On the consumption tax side, we’re all familiar with sales taxes such as the GST. Yet there is another kind of consumption tax, one which is levied directly on taxpayers rather than indirectly (the GST, which taxes retailers in order to tax consumers, is an indirect tax). Direct expenditure taxes are relatively unknown in Australia because they have not been used here (or pretty much anywhere). Yet they have long been advocated as a substitute for income taxes. The basic idea is to exempt income from savings (investment returns) from the personal income tax, since the difference between income and saving is consumption. Advocates of expenditure taxes such as Meade argued that a direct expenditure tax could in this way be levied at progressive tax rates (at higher rates for those who consume more), and that if accompanied by a tax on inherited wealth they were as equitable (or more so) than personal income taxes.
So the key difference between an income and a consumption (or expenditure) tax is whether that part of income we save is taxed each year. An income tax does so, a consumption tax does not.
While people are accumulating wealth, a consumption or expenditure tax has the same effect as a tax on wages since it falls on labour income but not investment income. So to raise the same revenue without taxing investment income, it must be imposed at higher rates, and these would fall on wages. On the other hand, once people began drawing down their wealth to spend it (mainly after retirement) they would be taxed on the draw-down of their capital, much as superannuation benefits were taxed up until 2007. So increases in wealth would still be taxed, but later than under an income tax. An income tax taxes annual investment returns from wealth whereas a consumption tax ‘waits’ until wealth is spent.
Another important difference between personal income taxes levied directly on taxpayers and consumption taxes levied indirectly through producers and retailers (sales taxes such as the Goods and Services Tax) is that the personal income tax is levied at progressive rates (tax rates rise with income) whereas a sales tax is generally levied at a flat rate (10% in the case of the GST).
More detailed analysis of the impacts of income and consumption taxes on equity and economic growth is offered by Brooks, Auerbach, and Henry. Those wanting to keep up with current Australian tax debates can visit the Tax Watch site, the ACOSS site or my blog site at https://pagdavidson.wordpress.com.
Who’s the fairest?
Whether a tax is equitable depends how we measure ‘ability to pay’. The equity case for income taxes rests on two pillars. First, that income or ‘spending power’ is a better measure of ‘ability to pay’ than expenditure because the ability to save and invest part of our income enlarges life choices (for example, to improve our housing security by buying a home). Second, that the ability to save is skewed in favour of the well-off and the tax-transfer should redistribute spending power to those with the least. The ‘ability to pay’ case could be described as the ‘soft argument’ for income taxes whereas the re-distributional case can be described as the ‘hard argument’.
Expenditure tax advocates put a contrary view: that spending is a better measure of well being and that by taxing the returns from saving, an income tax imposes a bias in favour of current spending and against future spending.

When we compare the impact of consumption taxes on households at different income levels, we find they are generally regressive (imposing higher tax rates on those with less income then those with more) when measured in proportion to household incomes, but close to proportional (a flat or uniform tax) when measured in proportion to spending.
The deferral of tax on savings under an expenditure tax benefits people who save the greatest part of their incomes. So whether an income or consumption tax is more equitable depends to a large extent on household saving patterns.

In any given year, high income earners in Australia save a great deal more than low income households. If we compare saving rates (saving as a proportion of household disposable income) among each 20% of Australian households ranked by income in 2010, we find that the top 20% saves on average about one third of its income (the red bars in the graph) but the bottom 20% spends more than its income (by drawing down savings or borrowing). So their average saving rate is -20%. This means that in a given year, one third of the income of the top 20% would be exempted from a tax on consumption, while low income earners would be taxed (at the rate of the consumption tax) on more than 100% of their income.

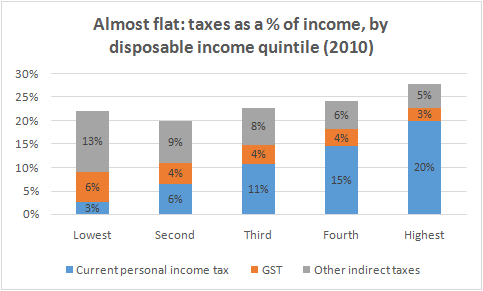
Due to these household saving patterns and the progressive tax rates that apply to personal income (including a high tax free threshold), a recent ACOSS analysis using ABS data found that in 2010 Australian income taxes (blue bars) were progressive while consumption taxes (red and green bars) were regressive (i.e. tax rates fall with income). The bottom 20% of households paid 3% of their income in income taxes and 21% in consumption taxes, while for the top 20% the order is reversed (20% in income taxes and 8% in consumption taxes). Joe Hockey please note, these are average (overall) tax rates, not marginal tax rates.
OECD analysis has found that consumption taxes are generally regressive, if their impact is measured in the conventional way – as a proportion of income in a single year. A direct expenditure tax at progressive tax rates (as distinct from a sales tax) might be progressive, but less so than an income tax with identical tax rates. This is due to the household saving patterns described above.
From the standpoint of ‘ability to pay’ in a given year, an income tax takes better account of differences in spending power by taxing those with more capacity to save at higher rates than those who spend all (or more) of their income due to financial constraints (for example unemployment or marital separation). A key exception is households with substantial wealth which they are drawing down mainly for consumption rather than investment, but those circumstances would be unusual today.
Advocates of expenditure taxation argue that the equity of taxes should be measured over a life-time, not a single year. If we accepted this argument, there are two key tests we can use to establish whether income or consumption taxes are fairer.
The first test is whether the annual saving pattern in the earlier graph is repeated across working life. If not, then taxing consumption instead of income would shift the incidence of tax across the life course (from youth to old age) but it would not necessarily advantage people who are better off throughout life.
If on the other hand, the ability to save is unevenly distributed among different groups in the community across life, replacing the income tax with a consumption tax would increase inequality of lifetime spending power. There are many possible reasons for this: inherited wealth, innate ability, and the other advantages that accrue to people who make the ‘right’ choice of parent including parental investment in education and being raised in a good suburb. If this is so, then exempting investment income from tax is likely to enlarge the life choices of those who are already ahead of the game.
We can shed light on this issue by establishing whether people with higher incomes across working life save a greater share of their income. Dynan and colleagues researched this question in the US and their answer to the question Do the rich save more? throughout working life was ‘yes’. They found that the median saving rate among people in the lowest 20% of overall working-age incomes was less than 1% compared with 11% for the top 20%.
What does this mean for tax policy? If people with higher incomes across their working lives save more, then the income tax is likely to be progressive across working life as well as in a single year. There’s evidence to support this view from the UK.
 Brewer posed the question: How does the tax system redistribute income? He found that the UK income tax was almost as progressive when women’s incomes were measured across working life as it was on an annual basis. The exception was a much larger ‘negative’ annual income tax rate for the bottom 20% (the blue bar on the left of the graph). This was due to the the system of tax credits for low paid workers which partly replaced family allowances in the UK at that time.
A second test of the equity of a tax across the life cycle is whether it imposes higher tax rates on people at those stages of life when people can best afford to pay (for example just before they have children and just after they leave home) and lower tax rates at stages when their finances are tight (for example when raising children and after retirement).
This is what the income tax system (together with social security and family payments) does. They play an insurance role – shifting resources from times when people’s ability to save is strongest to times when they are more likely to struggle financially.

Income taxes are lowest when people are young or old, highest in between, and slightly lower in the early child raising years. Consumption taxes are less sensitive to changes in the ‘ability to pay’ across the life cycle – though this is really another way of saying that they are more likely to be regressive in a given year (as discussed previously).
This discussion suggests two conclusions. First, that deciding whether taxes are equitable involves much more than a simple comparison of tax rates. Second, that despite the complexity of these issues the common sense view that income taxes are more progressive than consumption taxes is probably right.
There is another equity argument raised in favour of consumption taxes: that they are harder for high income-earners to avoid. Few tax experts support this view. As Warren and Auerbach point out, if economic activity is ‘off the radar’ of the income tax, it’s probably off the radar of consumption taxes also. Greece relies more on consumption taxes than most OECD countries, but from all accounts the Government there still has a big problem with tax avoidance. The argument that well-off people can take advantage of income tax shelters is an argument for closing tax shelters.
Which is more efficient?
Since the 1980s, when Governments struggled with low levels of economic growth, high inflation and high unemployment, the debate over the ideal mix of tax between income and consumption has shifted from equity concerns to the impact of tax on the efficiency of the economy. Taxes almost invariably have an economic cost, though of course this should be weighed up against the economic and social benefits the programs they finance.
The economic costs of taxation can be reduced by taxing investment incomes consistently (and not so much that mobile capital decides to invest elsewhere), and avoiding high tax rates on those whose workforce participation decisions are strongly affected by tax (it turns out this is mainly mothers on low incomes).
As the ‘Henry Report’ found, most studies of the economic costs of different taxes conclude that taxes on land, resources such as minerals, and inheritances have the least adverse effects on the economy, that consumption taxes are less economically ‘efficient’ than these taxes but more so than income taxes, and that taxes on business inputs and transactions such as Stamp Duties are the least efficient. They generally also conclude that taxes which are broadly based (raised in a consistent way on different items or economic activities) are more efficient than narrowly based taxes (State Payroll Taxes, which exempt the majority of businesses, are an example of a narrowly based tax).
But be wary of simple ‘league tables’ of the efficiency of taxes. The impact of a tax on the economy depends on many factors including how broadly based it is, how high are the tax rates, a country’s economic structure, levels of inflation and interest rates, and whether the tax clearly falls into one of the above idealised categories. For example, the treatment of investment income under the Australian personal income tax is actually a hybrid of income and consumption tax treatment. I’ll return to these issues in Part 3 of ‘A brief history of tax’.
In theory, moving from taxing income to consumption should encourage saving and investment but discourage workforce participation. The logic here is that the cost of an income tax is shared between wage earners and investors whereas a consumption tax that raises the same revenue would fall more heavily on wage earners. The claim that shifting from income taxes to consumption taxes would improve paid work incentives doesn’t withstand close scrutiny. A reduction in income tax rates would, all things being equal, boost workforce participation. But if this is paid for by higher taxes on spending, consumer prices would rise and the spending power of wages would either remain the same or fall.
When Randolph and Rogers evaluated the economic effects of proposals to replace the US federal income tax with an expenditure tax in 1995, they concluded that the proposed reforms would probably boost long-run economic growth but there was a great deal of uncertainty about the extent of any improvement, and a significant chance that they would reduce growth. A key reason for this ambiguity was the offsetting impacts of higher saving and investment and lower workforce participation.
In theory, a switch from taxing income towards taxing consumption should boost household saving because the portion of income that is saved would be exempted from tax. Academic studies over the past two decades have examined whether expenditure tax treatment of saving (either by allowing deductions for contributions to savings accounts or exempting investment income from tax) increases household saving. Engen, Gale and Scholz found that tax breaks for saving influenced the choice of savings vehicle (e.g. towards superannuation and away from interest bearing deposits) but were unlikely to strengthen household saving overall. The OECD found that tax breaks for saving by high income earners were generally ineffective because they were likely to save anyway in the absence of incentives.
Unlike most research on the economic impact of taxes, the work of Apps and Rees took account of the unpaid labour of women, including its significance as an alternative to paid work. One implication is that women, especially mothers whose potential wages are modest, are relatively sensitive to the impact of taxes on the spending power of their wages. They found that a shift from taxing income to consumption was likely to reduce their workforce participation, and that this would reduce household saving since single-income families were less likely to save than two-income families.
The strongest potential economic efficiency gains from taxing consumption rather than income come from two sources. The first is the impact of the removal of income taxes on levels of investment, especially across international borders. Investment is more ‘mobile’ than labour. For example, people can more readily move their savings out of Australia than pull up stumps and work overseas. This implies that taxes on investment income should ideally be lower that taxes on wages since investment is more responsive to tax levels. The risks to public revenue and economic growth from increasing mobility of capital (due to internationalisation and new technology) were emphasised by the Henry Report. Recently, Operation Wickenby has shone a spotlight on the use of tax havens by high income earners to shelter personal investment income and assets.
The second potential efficiency improvement from taxing consumption rather than income comes from an unexpected source: an increase in the taxation of the wealth of retirees as it is drawn down and spent. An income tax does not tax savings unless they are invested and yield income. A consumption tax taxes the draw-down of savings, which mostly happens after retirement. For example, a sales tax reduces the spending power of retirement savings. A shift from taxing income to consumption thus leads to a one-off devaluation of retirement savings. This is unlikely to affect saving decisions and future economic growth because it is largely unanticipated and retirement savings are the product of decisions made throughout working life. To the extent that this windfall public revenue gain is used to reduce other taxes that distort economic decisions, it is likely to improve economic efficiency.
Yet a sudden loss of spending power is unlikely to be popular among retirees and Governments will understandably face pressure to compensate them.
The impact of compensation for low income earners and retirees adds to the uncertainty surrounding the impact of a shift towards taxing consumption on economic growth. Altig and colleagues found that compensation, especially of retirees for the reduced value of the savings, substantially reduces any improvement in long run economic growth from taxing consumption more and income less. More broadly, the larger the ‘compensation package’ for higher consumption taxes, the weaker the long term improvement in growth.
An OECD study undertaken in 2008 of the effects of different taxes on economic growth has been cited by Australian advocates of taxing consumption more and income less. This study attempts to isolate the impact of taxes on long run economic growth rates in OECD countries from other factors likely to have an impact. It ranks different taxes according to their estimated long run effects on growth. The rankings are the same as that used in the Henry Report (as listed above). It finds that, on average, consumption taxes are more pro-growth than income taxes, and property taxes (such as Land Taxes), are more pro-growth than either income or consumption taxes, but that the extent of the difference in their economic impacts is difficult to quantify. It is worth quoting the conclusion in full:
‘Estimates of the effect on GDP per capita of changing the tax mix while keeping the overall tax-to-GDP ratio constant indicate that a shift of 1% of tax revenues from income taxes to consumption and property taxes would increase GDP per capita by between a quarter of a percentage point and one percentage point in the long run depending on the empirical specification.The magnitude of the estimated effect is larger than what would be reasonably expected. Given that there is a wide dispersion of the point estimates across specifications it is clear that the size of the effects cannot be measured precisely in a cross-country comparative setting. …Thus, the magnitude of the effects should be interpreted with caution.’ (p43)
This underscores the difficulty in separating the ‘pure’ impact of a change in the tax mix from all of the other factors that contribute to economic growth levels.
Conclusion
The research on the effects of replacing income taxes with taxes on consumption can be summarised as follows:
The impact of a shift from taxing income to consumption on the distribution of income (at least in a single year) can be measured reasonably accurately and is regressive. This is due to differences in household saving patterns. The impact on economic growth in the long run is likely to be positive, but hard to quantify. Any positive impacts on growth are mainly due to the effects of income taxes on investment levels (especially foreign investment) together with a windfall public revenue gain from taxing spending from the accumulated wealth of retired people.