
Negative gearing arouses passions on both sides: about a third think people are making legitimate deductions, a third think it’s a rort, and a third don’t know. This blog explains how negative gearing works, to help resolve these issues. A more complete analysis of negative gearing can be found in a recent ACOSS report, “Fuel on the fire”.
Hidden gems in the Tax Discussion Paper (2): we don’t rely a lot more on income tax than other countries.
Reading the press you’d think a key message from the Govt’s Tax Discussion Paper is that Australia relies a lot more on income tax than other wealthy countries. Not so! Read the fine print and we find that 63% of public revenue in Oz comes from income and income-like taxes compared with 61% across the OECD.
Racing against time: indexation of social security payments
Indexation of social security payments is a dry subject. Does it really matter if they’re indexed to MTAWE or CPI? You bet! The Government’s budget proposals to index pensions only to the CPI and not to wages would reduce them by $80pw in a decade compared with present indexation, and save a motza. The Rudd Government’s decision in 2009 to index family payments to CPI instead if wages has saved over $1B and has already cost a low income family with 2 children under 13 years $19pw. If Newstart Allowance had been indexed to wages as well as the CPI over the last 20 years, it would now be $115pw higher ($52 instead of $36 a day).
Hidden gems in the Tax Discussion Paper: Shocking news from Treasury – personal income tax as efficient as GST!
Business, Government, and “every pet shop galah” have been saying that we should rely less on personal income taxes and more on the GST because this would be good for the economy. In my blog ‘Who’s the fairest and most efficient of them all?” earlier this year, I challenged this view.
Treasury modelling of the economic impact of different taxes tucked away on p32 of the Government’s Tax Discussion Paper confirms my doubts. It should change the debate.
Now, Treasury has released the details of that modelling.
How the Budget was mugged (Treasury publishes the photo)
New Treasury Secretary John Fraser’s first speech includes a picture showing how the Federal Budget was mugged during the mining boom:
“The start of the structural deterioration in the Commonwealth’s budget position began
before the global financial crisis.”
The following chart, included in his slides, shows how the windfall revenue gains from the boom between 2002 to 2008 (grey bars, circled by me) were spent (green, blue and red bars).
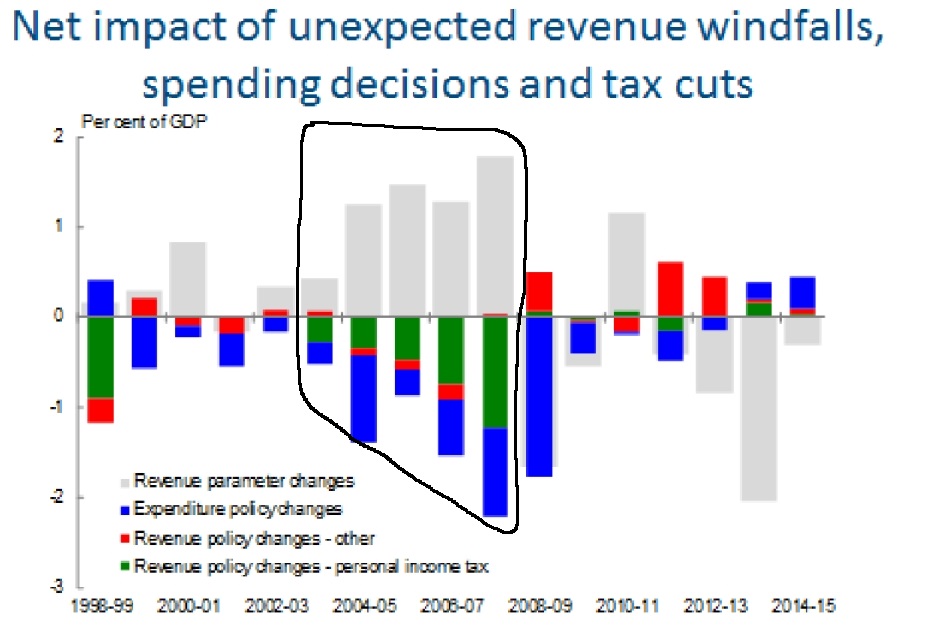
Bulging with company tax and capital gains tax revenues, the Federal Budget was mugged on its way to the bank and the proceeds spent equally on eight successive tax cuts (green bars) and spending programs (blue bars) that were often of dubious value – including the Seniors Supplement and easing of pension asset tests for wealthy older people in 2007, and the Education Tax Refund in 2009.
“The green and blue bars below the line show that these positive revenue surprises were largely handed back through personal income tax cuts or spent.”
By 2009 it was all over. The then Government tried valiantly (and succeeded) to avoid a recession through stimulus spending which was later wound back (the blue bar outside the circle).
Fraser didn’t put much emphasis on the fiscal damage caused by those tax cuts (he’s from Treasury), except to point to another well known story – the waste of revenues in poorly targeted tax breaks for superannuation:
“Generous income testing arrangements for Family Tax Benefits in the early 2000s and access to million dollar contributions to tax-preferred superannuation through 2006-07 were notable examples of middle or higher income welfare that contributed to the problem.”
As the ACOSS submission to the Audit Commission argued, these Budget decisions had huge opportunity costs. Instead of well targeted spending to deal with pressing problems – poverty, unaffordable housing, and the gaps in community services for people with disabilities and mental illness; people who had no need of more public support were offered ‘bonus’ payments and fresh opportunities to avoid income tax in old age.
Future generations will pay for all this if the most wasteful and profligate Budget decisions aren’t reversed. We’ll also pay a high economic and social cost if the harshest savings measures in last year’s Budget aren’t abandoned, starting with the denial of income support for unemployed young people. That Budget did include sensible measures, such as the removal of the Seniors Supplement, which should go ahead.
The bottom line though, is that Australian Government spending is for the most part well targeted (the graph below shows that our cash social security spending is third lowest in the OECD) a major reason Oz Governments spend less than most other wealthy countries. A Budget repair job which is confined to the spending side (as in 2014) will either fail (as in 2014) or cause social harm.

If we are to provide the health and community services needed by an ageing population, Australian (and State) Governments will have to raise more revenue, and learn to do this in a more economically efficient way. [No, I’m not ‘jumping to the GST conclusion’. Let’s open our minds a bit. Take a look, for example, at the reforms being discussed in South Australia].
Not as simple as it sounds: The Welfare Review in pictures
The Welfare Review Report has finally been released. It advocates a “new flexible social support system that is simpler, sustainable, coherent and outcomes focused”.
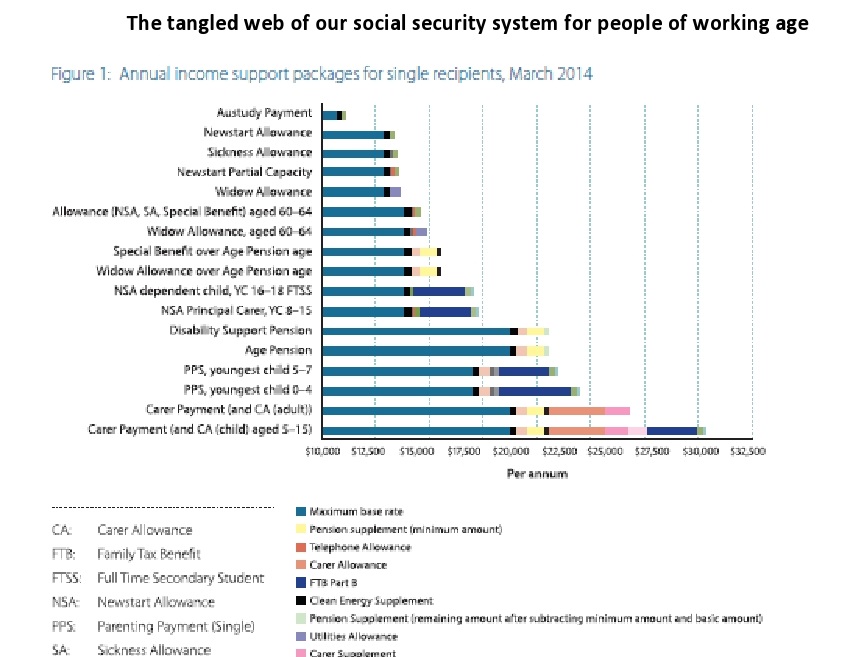
The Review proposes to replace the present tangled mess of 20 income support payments paid at various levels (see figure)

with ‘five main payments’ (see figure):
- Tiered Working Age Payment
- Supported Living Pension
- Child and Youth Payment
- Carer Payment
- Age Pension.
Sounds good, and a welcome change of tone from last year’s Budget. But unscrambling this egg is not as simple as it sounds, and nor is the recommended payment structure.
Long term unemployment: ‘achilles heel’ of the Job Services Australia model
The following is a paper I presented at the long-term unemployment conference in 2014. It argues that the fact that two thirds of people on Newstart Allowances have received it for over a year and half for over two years signals policy failure. Governments have failed to invest in the regular work experience, training and capacity-building, and connections with employers needed by most people who have been out of paid work a long time.
JSA (and before that Job Network) rewards providers for low-level job search assistance. Average caseloads are over 100. This might work when people are close to employment already, but it’s not good enough for those with low skills, weak (or no) employment experience, or a disability. In theory, paying providers according to job outcomes is a good idea, but as in other countries where this has been tried, it hasn’t worked out as the policy makers planned. To begin with, Governments only get the quality of employment services they are prepared to pay for. In Australia they have not been prepared to pay for it.
The previous Government built a program based on short-term low quality training (average spend $300 per course, % employed after course 30%). The present Government is building a new one based on Work for the Dole (average spend $2,000, % employed after program 23%). Neither approach was successful (except in the sense that it kept unemployed people busy).
Is there a magic pudding? A quick analysis of CPA Australia’s GST proposals
This is a quick off the cuff analysis of CPA Australia’s report: Tax reform in Australia, the facts, a day after its release. In the absence of time to study the report more closely, and critical details of the modelling and presentation of data, I raise as many questions as answers. But they are important questions – including how a revenue neutral change in the tax system leaves all households better off. There are efficiency gains from good tax reform but the magic pudding remains elusive!
The CPA proposals are a welcome change from standard ‘tax mix shift’ reform proposals which trade off a higher GST for lower income taxes. Instead, most of the revenue gained from higher GST would be used to remove some of the most inefficient (and unfair) State taxes such as Stamp Duties on insurance. Aside from the proposed income tax cuts, most of the taxes to be replaced fall mainly on household consumption, so the implications for the distribution of spending power among households are less clear cut than a straight consumption tax for income tax switch, which is strongly regressive. See my previous blog ‘Who’s the fairest of them all’ and ACOSS analysis ‘Paying our fair share’.
The CPA advances four reform options:
- A 10% GST with health, education and fresh food exemptions removed to raise $12B in 2015 to replace stamp duties on insurance & motor vehicles ($8B) and modestly reduce property Stamp duties and other indirect taxes ($2B), with the remaining $2B used for income tax cuts and an increase in income support payments.
- A 15% GST off the existing base to raise $26B to replace stamp duties on insurance & motor vehicles ($8B), substantially reduce property Stamp Duties ($10B) and other indirect taxes ($2B), with the remaining $6B used for income tax cuts and an increase in income support
- A 15% GST with health and education in the base to raise $37B to replace stamp duties on insurance & motor vehicles ($8B), abolish property Stamp Duties ($13B) and other indirect taxes ($2B), with the remaining $14B used for income tax cuts and an increase in income support
- 15% GST with health education and fresh food in the existing base to raise $42B to replace stamp duties on insurance & motor vehicles ($8B), abolish property Stamp Duties ($13B) and other indirect taxes ($2B), with the remaining $19B used for income tax cuts and an increase in income support.
Using a model developed by KPMG, the report estimates the impact of these options on economic growth and on households (divided into groups of 20% by household ‘equivalent’ income). It also makes a number of claims about the inefficiency of the current tax ‘mix’. This blog is in two parts: ‘what’s clear’ (some obvious points) and ‘what’s not clear’ (questions that need to be clarified).
What’s clear
1. Australia does not rely a lot more on income taxes (broadly defined) and a lot less on consumption taxes, than the OECD average.
The international tax revenue data in the report shows that, when social insurance contributions in other OECD countries are added in, 58% of tax revenue in Australia comes from taxes on income compared with an OECD average of 60% – or 63% compared with 61% if Payroll taxes are included (figure 2-8)
The share of tax revenue raised from consumption taxes is 27% in Australia compared with an OECD average of 33%. There’s much more to consumption taxes than GSTs and VATs, including State taxes such as Stamp Duties that fall on consumption.
2. The increases in the GST modelled for the report by KPMG would reduce economic growth for the first three years after the reform.
It is well known that one of the short term effects of an overall rise in consumption taxes is that the economy slows, due to the impact of higher prices (just ask the Japanese). To be precise, it increases household consumption in the years between announcement of the reform and implementation as people rush to buy good at existing prices, then reduces it).
3. Abolishing inefficient State taxes would boost growth in the long run
It’s not surprising the modelling finds that GDP would grow faster over the long term if these taxes were abolished. Taxes such as Stamp Duties have well known negative impacts on investment and growth. Taxing business ‘inputs’ rather than final income or consumption or assets such as land and mineral wealth is inefficient as it distorts household and business investment decisions (for example by discouraging people who need it from taking out insurance, and penalising decisions to move house).
The $27.5 billion dollar question is: by how much? This is notoriously difficult to estimate. As with all macro-economic modelling, results depend on assumptions. The report appears to take this a step further by assigning the projected economic efficiency gains to households (which no Government would be brave or foolish enough to do).
4. Low income households don’t usually benefit from tax cuts
One quarter of households, including the vast majority of those in the bottom 20%, pay no income tax (but they do pay consumption taxes), so they would be worse of in the absence of social security payment increases if consumption taxes increased.
As the above ACOSS report argues, relying on social security payment increases to sustain spending power is risky in an environment when these payments are under threat (see last year’s Budget)
What’s not clear
1. Why do all households gain from revenue-neutral tax reforms?
All four proposals are revenue neutral. They neither increase nor reduce taxes overall. So in the short term, reform is a zero sum game with winners and losers. Yet all households appear to win in the modelling.
A close look at Appendix ‘C’ shows that his happens because of a line item called ‘increase in income before tax’. Why would income increase before tax (apart from social security payments increases which are accounted for separately)?
One possible reason is the claimed ‘efficiency dividend’ from the reform. That is, the economy grows more quickly because taxes are less distortionary. But that’s a long term impact. As indicated, the model shows that GDP growth slows for the first three years and household consumption is projected to fall for the first five years.
If ‘input taxes’ (such as Stamp Duties) are replaced by a tax on consumption (like the GST) we would expect households to be slightly worse off in the short term, in the absence of compensation. This is because in the short term, some of the gains from abolition of input taxes would ‘leak’ to sectors other than Australian households (especially exports).
2. What happens of we exclude ‘increases in income before tax’ and focus on the impact of the tax changes?
If we separate out the effects of tax and social security changes (higher GST, lower Stamp Duties, and income tax cuts and social security increases) from the projected ‘increases in income before tax’ we find that the first reform option (removal of GST exemptions, abolition of some Stamp Duties, a reduction in the first marginal tax rate from 19% to 18.5%, and modest social security increases) reduces household spending power for the bottom 2 quintiles and raises it for others.

This is the pattern of short-term winners and losers we would expect from such a change (red bars), though the average losses at the bottom end are much larger than expected:
- Low income households are disproportionately affected by the consumption tax changes
- Since only the lowest marginal income tax rate is cut, middle income households gain the most, but high income earners also gain because the tax cuts flow through to them as well.
When the ‘increases in income before tax’ are added in (blue bars) everyone wins and the reform is distributionally neutral (see Figure 3-4 in the report).
But where do these income increases come from? The report refers to ‘increased incomes as a result of improved efficiency in the economy’ (p14). If this is where they come from (and these look like brave assumptions), how would these efficiency gains flow through to households in the first year of the reform (2015-16)?
3. What is the effect of the consumption tax changes on their own?
It would be worth knowing what the effect of replacing Stamp Duties with a higher GST has on the spending power of households at different income levels, since this kind of reform is rarely modelled. The impacts are not obvious since Stamp Duties themselves largely fall on household consumption – so the reform would replace one set of regressive taxes with another. Its effects would depend on the spending patterns of different households (e.g. on food, home purchases, car purchases, insurance, etc).
It’s good to see more information out there on the impact of different tax reforms, and it would be even better if some of the results in the report were explained more fully.
The ‘size of Government’ obsession: public spending and economic growth
This week, the PM suggested we do what the New Zealanders had done and put a cap on the size of the Federal Government.
‘And one of the points that I made in my speech to the Press Club last week is that if you look at what New Zealand did with fiscal consolidation, they had a very tight clamp on new spending. They didn’t engage in big cuts. They had a tight clamp on new spending and New Zealand has got government, as a percentage of GDP, from 35 per cent to 30 per cent – a very big change in just a few years.’
The suggestion is that rather than change the direction of policy (by raising taxes or cutting spending more fairly), the Budget will just move more slowly in the same direction, or perhaps not at all! With no steering, no acceleration and no brake, there’s not a lot of room for the next Budget to move. Might as well garage it for a year and avoid the political angst!
Let’s set aside the important question of whether the Budget should stimulate the economy or consolidate public finances (last year’s Budget struck a sensible balance on that score – the big cuts were postponed to future years, but the recent RBA decision to cut interest rates shows that circumstances have since changed for the worse).
The-not-so hidden assumption behind the PM’s statement, and last year’s Budget, is that smaller Government is better. That’s why all of the action in last year’s Budget was on the spending side. Given the targeting of most public spending in Australia, that almost inevitably means the Budget was a regressive.There’s not much room for large cuts outside social security, health and education.
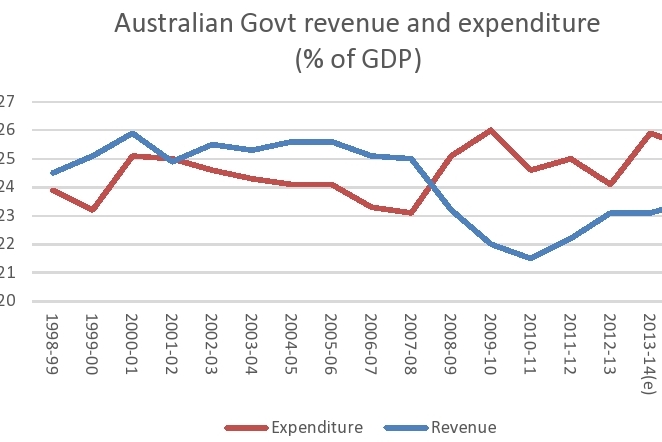
Yet, as ACOSS argued in its Commission of Audit submission in 2013, most of the damage to the Budget bottom in recent years came from sliding revenues, not higher expenditures.
There’s on old neo-liberal economics argument that smaller Government is better for long term economic growth (setting aside any temporary economic stimulus) because taxes and spending dampen and distort market signals in the economy.
In the same submission, ACOSS addressed this issue by dipping into what economic research said about the size of Government and economic growth. It turns out that that there is a (loose) association between size of Government and economic growth, though it is hard to clearly identify the impact of public spending and taxing given all of the other factors that determine long term growth levels. There’s also the problem of reverse causation: the slower the economy grows, the higher is public spending on unemployment and other benefits.
But the real story is not about the quantity of public spending and taxing, it’s the quality that matters for long term growth. Some forms of spending, such as public infrastructure investment, are more growth enhancing than others. Countries that achieve their social goals in a cost effective way are also more likely to be rewarded with stronger economic growth.
The size of Government is mainly a political (and ideological) decision, not an economic one.
Here’s an extract:
ACOSS Commission of Audit submission (2013)
Appendix 5: The ‘size of Government’ and economic growth.
The effect of the size of public revenues and expenditures on long term productivity and economic growth has been vigorously debated for many years. In studies exploring this relationship, ‘size of Government’ is usually proxied by public revenues (or tax revenues) or public expenditures as a proportion of GDP. Early studies suggested that there was an optimal size for Government, above which future economic growth would be constrained.43 A number of subsequent empirical studies of the public revenues and expenditures and economic growth have found that higher revenues and expenditures are associated with slower long-term growth in wealthy countries.44
However, it does not follow from a simple association between Government size and economic growth that one ‘causes’ the other. There are four problems with this apparently ‘simple’ story:
1. The character of public spending and taxes may be as important as its ‘size’. Studies have found that pubic investment in physical infrastructure and human capital development (education) are positively associated with economic growth. Much of what is usually classified as ‘social expenditure’ promotes employment participation and productivity. More broadly, the efficiency of the public sector matters.45
2. Whether or not the size of Government has an impact on economic growth, other policies may have a countervailing effect. While long term economic growth rates have been stronger in recent decades in the Anglo-Saxon countries (which have below average tax levels) than in continental Europe (with above average tax levels), the Nordic countries have both high tax levels and high long term economic growth rates (see table below). One suggested explanation is that the economic openness of the Nordic countries more than compensates for their relatively high tax and expenditure levels 46 .
Tax levels and growth in three types of welfare systems
| Country group | tax to GDP ratio (%) | Average annual real GDP growth (1995 to 2004 – %) |
| Nordic | 45.7% | 2.5% |
| Anglo-saxon | 31.6% | 2.3% |
| Continental European | 38.8% | 1.5% |
Bergh & Henriksen, 2011, ‘Government Size and Growth: A Survey and Interpretation of the Evidence’, Research Institute of Industrial Economics, IFN Working Paper No. 858, 2011 Stockholm.
3. Causation may be in the opposite direction. For example, slower long term growth rates in many continental European countries may be associated with higher unemployment rates (which increase the cost of unemployment benefits) or older populations (which increase the cost of pensions and health care services).
4. In any event, Australia, which is the third-lowest spending country in the OECD, and has a relatively cost efficient social security system and human services, has considerable room to move before higher public revenues and expenditures put a brake on economic growth.
43. For example, Barro 1990, ‘Government spending in simple model of endogenous growth’, Journal of Political Economy Vol 98, No5.
44. Bassanini and Scarpetta 2001, ‘The driving forces of economic growth’, OECD Economic Studies No 33.
45. Angelopoulos et al 2008, Does public sector efficiency matter? Revisiting the relation between fiscal size and economic growth in the world sample, Public Choice, Springer, vol. 137(1), pages 245-278
46. Bergh & Henriksen, 2011, ‘Government Size and Growth: A Survey and Interpretation of the Evidence’, Research Institute of Industrial Economics, IFN Working Paper No. 858, 2011 Stockholm
A brief history of tax (Part 3): the trojan horse.
‘The tax code, once you get to know it, embodies all of the essence of life: greed, politics, power, goodness, charity. Everything’s in there.’ Sheldon Cohen, Former Commissioner of the US Internal Revenue Service.
Tax reform is back on the agenda. Since those who fail to study history risk repeating it (and I was involved in the latter-day history of tax reform) I’m writing this 3 part series as a guide for those involved in the next phase. Parts 1 and 2 dealt with the dominance of income tax since WW2 and the challenge from consumption taxes since the 1970s. This part: the ‘Trojan Horse’ discusses new thinking about taxes and their impact on the economy. It argues that our income tax already incorporates elements of a tax on consumption, that we should move beyond a simple dichotomy (and old arguments) between taxing income or consumption, and explore fresh ideas for reform.
