
Publications
2025
Davidson, P and Hall, J (2025), Homes for living, not wealth creation: Tax and expenditure reforms to improve housing affordability and equity, ACOSS, Sydney

Deduct the losses, capitalise the gains:
how negative gearing works
Negative gearing arouses passions on both sides: about a third think people are making legitimate deductions, a third think it’s a rort, and a third don’t know. This blog, based on a recent ACOSS report, “Fuel on the fire”, takes a closer look.
In negative gearing strategies, investors borrow to buy an asset (such as a rental property), and structure the loan so that interest payments and other costs exceed income from rent. This investment ‘loss’ is then deducted from their other income, such as wages. On the face it, perfectly legitimate: the tax system allows people to deduct their expenses from their income and this is what they’re doing. The puzzle is why people deliberately make losses for many years on their investments. Even if they save on tax, aren’t they losing overall? The answer to this puzzle is the key to understanding how negative gearing works and whether or not it’s a legitimate feature of our income tax system.
How negative gearing works
To illustrate with an example (a simplification, not a real one):
“Ms Invest buys a rental property for $600K, with an annual rental return of $25K (around $500pw)
Her annual running costs (maintenance, agents fees, etc) are $10K
To maximise her borrowing capacity and take advantage of negative gearing arrangements, Ms Invest uses a more expensive ‘interest only’ loan, on which the bank gives her discretion to make higher or lower payments each year, so that the investment consistently makes a cash ‘loss’.
Now, say she borrows 80% of the value of the property (around $500K) and pays $25K a year in interest (5%).
So her annual expenses are $35K and income from rent is $25K: a cash ‘loss’ of $10K before tax.
Ms Invest deducts this $10K ‘loss’ against her wage of $150K (over half of geared property investors earn at least $100K, according to RBA research cited in the ACOSS Report).
Her marginal tax rate is 39% (including the Medicare Levy). So the tax saving from this deduction is around $4K. Taking this into account, she’s making an annual after-tax cash ‘loss’ of $6K a year ($10K – $4K). [there are other tax benefits like building depreciation but let’s set these aside to simplify things]
So why does she do it? The answer – and this is what really drives negatively geared property investments – is capital gain. That is, the increase in the value of the property each year which Ms Investor will cash in (or ‘realise’) when she eventually sells it. Until then, she can use it to reduce her income tax. When she does sell, only half the increase in the property’s value (the capital gain) is taxed. This ‘50% discount’ was introduced in 1999, just before negative gearing strategies really took off.
Let’s say the property increases in value by 5% a year – which is conservative in capital city property markets today. That’s $30K a year.
So instead of making an annual ‘loss’ of $10K before tax, she’s actually making a profit on the investment of $20K ($30K – $10K). After tax, her annual profit is $18K ($24K on the capital gain minus $6K on the other income and expenses). In effect, taking account of Capital Gains Tax and deductions for expenses, the annual tax rate on her investment is just 10% ($2K divided by $20K).
This is the problem with negative gearing: deductions are being claimed for investment ‘losses’ that aren’t really losses. Ms Invest is making cash ‘losses’ before she sells the property, but then profits when she sells it years later and makes a lightly taxed capital gain.
Solutions
There are three ways to fix this problem.
One option is to tax capital gains each year as they accrue (before the property is sold), at the same marginal tax rate at which the deductions are being claimed (in this case 39%). The problem with this is that Ms Invest might not have the cash-flow to pay this tax, and it would require an annual valuation of the property. This is not a practical option.
A second option, advanced by the Henry Report, is to reduce the tax discount for individual capital gains from 50% to 40% (so that 60% of gains are taxed), and then only allow investors to deduct 60% of their investment expenses. This ensures that gains and losses are at least taxed in the same way: 60% of capital gains are taxed and 60% of the associated losses are deductable (instead of 50% of the gains and 100% of the losses). The problem with this is that there’s still a timing advantage. Ms Invest can claim deductions for many years but is only taxed on the capital gain when the property is sold. As they say, time is money!
The third option deals with this problem by delaying the deductions. To stop people claiming deductions against investments which aren’t actually making losses, their investment ‘losses’ could no longer be deducted from their wages. Instead they would be ‘quarantined’ and carried forward to be deducted against future cash profits from the investment. If the property is not negatively geared, the expenses could still be deducted as they accrue, so nothing changes. If it is negatively geared, the deductions might be delayed a few years until the investment makes a cash profit (due to lower interest payments and higher rents). In extreme cases they might be delayed until the property is sold, in which case the investment expenses are deducted against the capital gains.
The idea is to ‘ring-fence’ income and losses from an investment so that gains and losses are treated in the same way (symmetrically). The deductions are not denied, they are delayed.

This is not a new idea. It was adopted by the Hawke Government in 1985 (and a mythology has emerged over its impact on rental property investment and rent levels, as explained in the ACOSS Report). Similar rules are in place in most wealthy countries including the United States and United Kingdom (see table).
The same principle is already applied in other areas of Australian tax and social security policy:
- Investment property losses cannot be deducted against other income in the income tests for social security and family payments.
- Trust losses are quarantined within the trust and cannot be offset against the income of the beneficiaries.
- Capital losses are quarantined and carried forward so that they can only be offset against capital gains.
- Some active business losses (e,g, hobby farms) are quarantined and cannot be deducted against the owner’s other income.
These quarantining rules are all designed to tackle a common problem: the tax treatment of investment income and expenses is lopsided. Investment income is taxed concessionally, so allowing unlimited deductions against other income (that’s taxed at ‘normal’ rates) threatens the integrity of the tax system. These rules were developed in response to real problems (rorting of the tax system and revenue leakage), not just theoretical ones.
In the case of negative gearing, the underlying problem is the tax treatment of capital gains. This problem extends well beyond rental property, to geared investment in shares (leveraged equities), agricultural schemes (like the ill-fated Timbercorp), racehorses and works of art – personal investments that mainly yield income in the form of capital gains. The same quarantining rules should apply to these investments.
As the ACOSS Report spells out, this is not just an equity and tax integrity problem: it blunts the efficiency of investment, and the economy. The tax system is encouraging people to borrow more than they otherwise would to punt on the capital gains in the property market. We’ve seen over the housing booms of the 80s and 00s what this does to housing costs and macro-economic stability. And Timbercorp is a case study of the harm that can come when people are encouraged to invest with tax deductions in mind rather than the quality of the investment.

Reading the press you’d think a key message from the Govt’s Tax Discussion Paper is that Australia relies a lot more on income tax than other wealthy countries. Not so! Read the fine print and we find that 63% of public revenue in Oz comes from income and income-like taxes compared with 61% across the OECD.
What the Govt’s Tax Discussion Paper says about our reliance on income tax
When he released the Tax Discussion Paper at an ACOSS function last week (the one oddly titled “Rethink” – Rethink what? Most of the work was done in the Henry Report), Treasurer Joe Hockey repeated the hoary old argument that Australia relies too much on income taxes:
“Australia’s heavy reliance on income taxes may be unsustainable”

I pointed out in my last blog that the Discussion Paper found that personal income tax is no less efficient than the GST, though company income taxes detract more from economic growth.
But there’s another factual problem here: we don’t rely a lot more than other OECD countries on income taxes, when apples and compared with apples.
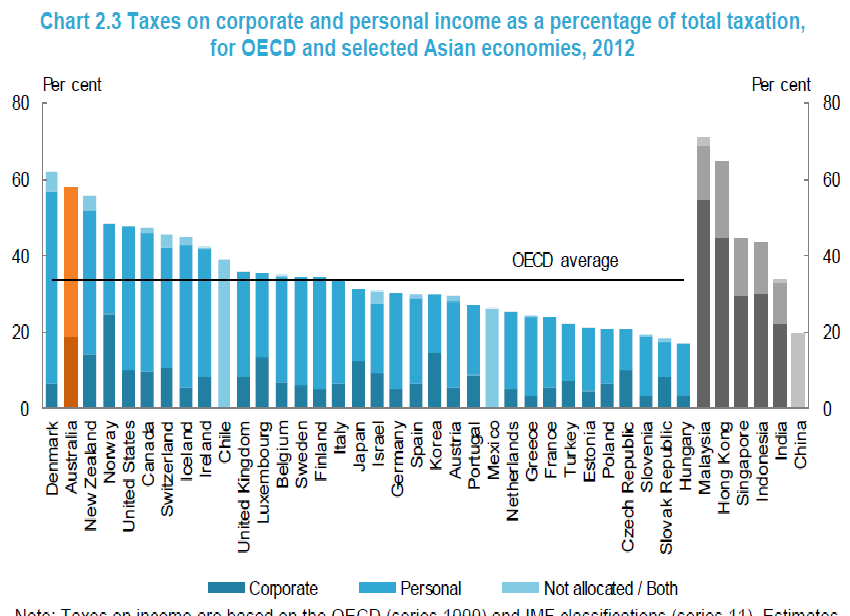
The claim that we rely heavily on personal and company income taxes is illustrated by this graph in the Report. It compares revenue from personal income and company taxes for all levels of Govt across the OECD. On this count, we’re second highest to Denmark (see yellow bar).
The Discussion Paper notes that:
“Australia relies more heavily on income taxes on company and individual income (often
termed ‘personal income tax’, including by the OECD) than other developed countries (Chart 2.3)
There’s a problem with this comparison. One of the things we have in common with Denmark is that we don’t levy social insurance taxes to pay for public pensions and unemployment benefits. Most OECD countries do. These are taxes on income, and should be included.

In its next graph, the Discussion Paper includes social insurance taxes, and also Payroll Taxes which have a similar purpose (Payroll Taxes are ultimately a tax on wages. They were introduced in Australia to finance Child Endowment). Here the story changes. We’re close to the middle (yellow bar); with 63% of public revenue coming from these taxes compared with 61% across the OECD.
The Discussion Paper notes that:
“Direct forms of taxation — individuals and corporate income taxes, compulsory social
security contributions plus payroll taxes — comprise around 63 per cent of taxation in
Australia. This compares to the OECD average for direct taxes of 61 per cent (Chart 2.4).”
Some argue that our Superannuation Guarantee should also be included, and that this would raise our reliance on income taxes overall. The trouble with that argument, as the Discussion Paper points out, is that:
“Australia’s compulsory superannuation system — the superannuation guarantee — is
sometimes equated to a social security tax. However, as it is paid directly into private
superannuation accounts (currently set at 9.5 per cent of an employee’s ordinary time
earnings) rather than to the government, it does not meet the definition of a tax.”

Put this together with the fact that Australia has low tax revenue overall (seventh lowest in the OECD, see the yellow bar), and our overall reliance on income taxes doesn’t look so high.
Our reliance on company income tax is above average (second to Norway). What do have in common with Norway? A profitable mining industry. Our company income tax is in part, a tax on mining rents (recall that the Henry Report proposed to replace part of it with a Resource Rent Tax).
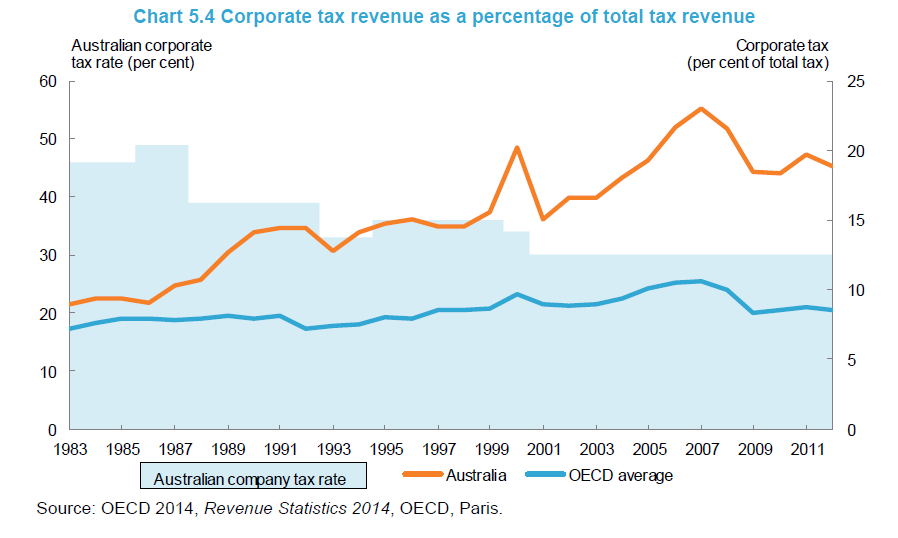
Company tax revenue boomed from the early 2000s, just as the mining boom hit its straps (see the yellow line). Large reductions in iron ore and coal prices in recent years have hit company income tax revenues hard, and this is the main single cause of our present Budget problems.
Those Budgetary problems are getting worse. While we clearly can’t sit back and wait for income tax bracket creep to sole them, strengthening the income tax system has to be part of the solution.
Hidden gems in the Tax Discussion Paper: Shocking news from Treasury – personal income tax as efficient as GST!
Business, Government, and “every pet shop galah” have been saying that we should rely less on income taxes and more on the GST because this would be good for the economy. In my blog ‘Who’s the fairest and most efficient of them all?” earlier this year, I challenged this view.
Treasury modelling of the economic impact of different taxes tucked away on p32 of the Government’s Tax Discussion Paper confirms my doubts. It should change the debate.
Now, Treasury has released the details of that modelling.
Here’s the graph from the Discussion Paper comparing the “marginal excess burden” (efficiency loss) of different taxes. The marginal excess burden is the loss of future spending power across the economy per dollar of revenue raised from a tax. A low MEB means a tax is efficient; a high one suggests we might look elsewhere for public revenue.  The “efficiency ranking” of taxes here is similar to other studies, with taxes on land the clear winner and Stamp Duties receiving the wooden spoon. Company income tax is growth-reducing to the extent that capital is mobile (and the assumptions the model makes about this are critical).
Comparing labour income taxes and GST: economically, there’s nothing in it!
But the real story is the comparison between income taxes on labour and the GST: if the Treasury’s modelling is accurate there’s nothing in it! The MEB for a flat rate income tax on labour incomes was 21%, that for the GST 19%. Contrast this with Stamp Duties at 72%, and there’s nothing in it. A flat-rate labour income tax is about as efficient as the GST (compare the two blue dots in the graph).
“Our estimate of the marginal excess burden on individual’s labour income and GST are very similar at around 21 cents and 19 cents respectively. This aligns with the intuition that taxation of labour income and GST both effect the real purchasing power of wages, with a similar incidence on labour supply.”
and:
“Compared to taxes with a relatively significant impact on economic growth and living standards (such as company tax), individuals income tax is usually considered to have a comparatively moderate impact on the behaviour of most people, and relatively minor adverse impacts on economic growth and living standards”, p41
It turns out that consumption taxes also reduce work incentives, because they reduce the spending power of wages. Indeed, tax theory suggests that consumption taxes fall more heavily on labour (and the accumulated savings of retired people) than income taxes. So a shift from taxing income to consumption is likely to reduce work incentives overall – This is argued in my blog ‘Who’s the fairest and most efficient of them all?’
Treasury’s modelling suggests that a progressive income tax (in which tax rates rise with income, represented by a dash in the graph) is less efficient than a flat one (in which tax is levied at the same rate on everyone, represented by a dot).
But here there’s a glitch in the model. Households are represented by a single family, so the model is unable to distinguish between work incentives for men and women, two income families and single income families, or families with and without children. The model simply assumes that as income tax rates rise, they have a greater (negative) impact on workforce participation. And it does not take into account the combined impact of income tax rates and social security income tests, which mainly impact on unemployed people and women in low and middle income families.
As the Treasury knows, in the real world it is low-income women not high-income men who are most sensitive to taxes when they decide whether to increase their paid working hours:
“The groups most likely to respond to high effective tax rates include the unemployed and
lower-income earners (who often work part-time). Primary care givers, such as parents with young children, are also relatively responsive to effective tax rates but they also respond to other costs associated with working, such as child care.” p45and:
“In the absence of any changes to payments or assistance, and all else being equal, targeting tax cuts at the lower end of the income spectrum should generate a higher participation response than if the same value of tax cuts were delivered at higher incomes, “p45.
So it’s not obvious that a progressive income tax is worse for labour incentives than a flat income tax. There’s abody of research that suggests the opposite.The highest income tax rates fall on married men, and the sensitivity of the working hours of married men to an increase in tax is close to zero in research cited by Treasury.
Broadening the GST: nothing in this either
The other eye opener is the difference in the economic impact of the current GST (which taxes about half of all consumption, represented by a dot in the graph) and a broad based one (which taxes all consumption, represented by an x). Again, there’s nothing in it, a difference of just 2%!
It might be tough for retailers to distinguish between the GST treatment of a pizza and a pizza roll, but it makes little difference to growth levels in the wider economy.
Income taxes and investment: more of a story here
The Treasury modelling also challenges the view that a switch away from taxing personal income would be good for investment, arguing that investment is more sensitive to global rates of return than the impact of local taxes on investment incomes.
On the other hand, it concludes that foreign investors are very sensitive to company income tax rates. The MEB for company tax is estimated at 50%. Treasury argues that company taxes ultimately fall largely on workers as a result of lower foreign investment in Australia. There are two critical assumptions here: perfect capital mobility (without which Treasury says the MEB could fall by 20%) and that ‘economic rents’ comprise about one seventh of profits taxed in Australia (if this is doubled then the MEB also falls by about 20%).
Economic rents are above-normal profits flowing from location or firm specific inputs such as natural resources. If they are taxed properly, there are virtually no adverse economic impacts because the tax has no effect on investment decisions. So the higher the proportion of company income taxes that come from economic rents, the less likely they are to have adverse impacts on the economy.
The tax that dare not speak its name – a properly designed mineral resources tax – is a tax on economic rents. This was the main reason the Henry Report argued for a switch from taxing company income generally towards a tax on above-normal profits from mineral resources.
The ideal tax: Land
Finally, since land is immovable, a broad based tax on all private land (such as council rates) has no adverse economic impacts. Indeed, the Treasury estimates it would improve economic efficiency by 10%. This positive view of the economic effects of a broad tax on Land is uncontroversial.
Don’t always believe what you read in the papers
This is a timely warning for Government, tax lobbyists, the media, and tax reform junkies. Don’t always believe what you see and hear in the news.
It’s also a warning about tax reform modelling. It’s a very imprecise science. Many people have quoted the findings of a 2008 OECD study which found that consumption taxes were more efficient than taxes on personal income. A close reading of that report reveals the caveats:
‘Estimates of the effect on GDP per capita of changing the tax mix while keeping the overall tax-to-GDP ratio constant indicate that a shift of 1% of tax revenues from income taxes to consumption and property taxes would increase GDP per capita by between a quarter of a percentage point and one percentage point in the long run depending on the empirical specification.The magnitude of the estimated effect is larger than what would be reasonably expected. Given that there is a wide dispersion of the point estimates across specifications it is clear that the size of the effects cannot be measured precisely in a cross-country comparative setting. …Thus, the magnitude of the effects should be interpreted with caution.’ (p43)
In contrast to the latest Treasury research, modelling by KPMG Econtech of the impact of different taxes on the Australian economy which was conducted for the Henry Review found that consumption taxes were significantly more efficient than personal income taxes (though the overall efficiency rankings of different taxes were the same as above).
This raises a serious question for policy makers: is our economic modelling of the impact of taxes reliable enough to draw firm conclusions for policy? This question was posed recently by a study commissioned by the Mirrlees review in the UK. The authors concluded that arguments for the removal of taxes on investment incomes were getting well ahead of the reliability of the research.
If the impact of greater reliance on consumption taxes on the economy is uncertain, its (regressive) impact on household spending power is clear. (see my blogs: ‘Who’s the fairest and most efficient of them all?’ and ‘ACOSS report shows taxes are lower and less progressive than people think.’)
It’s time to move on from the unproductive and divisive debate over whether to tax consumption more and income less, and get down to the business of making both income and consumption taxes fairer and more efficient. There’s plenty that needs to be done.

Is there a magic pudding?
A quick analysis of CPA Australia’s GST proposals
This is a quick off the cuff analysis of CPA Australia’s report: Tax reform in Australia, the facts, a day after its release. In the absence of time to study the report more closely, and critical details of the modelling and presentation of data, I raise as many questions as answers. But they are important questions – including how a revenue neutral change in the tax system leaves all households better off. There are efficiency gains from good tax reform but the magic pudding remains elusive!
The CPA proposals are a welcome change from standard ‘tax mix shift’ reform proposals which trade off a higher GST for lower income taxes. Instead, most of the revenue gained from higher GST would be used to remove some of the most inefficient (and unfair) State taxes such as Stamp Duties on insurance. Aside from the proposed income tax cuts, most of the taxes to be replaced fall mainly on household consumption, so the implications for the distribution of spending power among households are less clear cut than a straight consumption tax for income tax switch, which is strongly regressive. See my previous blog ‘Who’s the fairest of them all’ and ACOSS analysis ‘Paying our fair share’.
The CPA advances four reform options:
- A 10% GST with health, education and fresh food exemptions removed to raise $12B in 2015 to replace stamp duties on insurance & motor vehicles ($8B) and modestly reduce property Stamp duties and other indirect taxes ($2B), with the remaining $2B used for income tax cuts and an increase in income support payments.
- A 15% GST off the existing base to raise $26B to replace stamp duties on insurance & motor vehicles ($8B), substantially reduce property Stamp Duties ($10B) and other indirect taxes ($2B), with the remaining $6B used for income tax cuts and an increase in income support
- A 15% GST with health and education in the base to raise $37B to replace stamp duties on insurance & motor vehicles ($8B), abolish property Stamp Duties ($13B) and other indirect taxes ($2B), with the remaining $14B used for income tax cuts and an increase in income support
- 15% GST with health education and fresh food in the existing base to raise $42B to replace stamp duties on insurance & motor vehicles ($8B), abolish property Stamp Duties ($13B) and other indirect taxes ($2B), with the remaining $19B used for income tax cuts and an increase in income support.
Using a model developed by KPMG, the report estimates the impact of these options on economic growth and on households (divided into groups of 20% by household ‘equivalent’ income). It also makes a number of claims about the inefficiency of the current tax ‘mix’. This blog is in two parts: ‘what’s clear’ (some obvious points) and ‘what’s not clear’ (questions that need to be clarified).
What’s clear
1. Australia does not rely a lot more on income taxes (broadly defined) and a lot less on consumption taxes, than the OECD average.
The international tax revenue data in the report shows that, when social insurance contributions in other OECD countries are added in, 58% of tax revenue in Australia comes from taxes on income compared with an OECD average of 60% – or 63% compared with 61% if Payroll taxes are included (figure 2-8)
The share of tax revenue raised from consumption taxes is 27% in Australia compared with an OECD average of 33%. There’s much more to consumption taxes than GSTs and VATs, including State taxes such as Stamp Duties that fall on consumption.
2. The increases in the GST modelled for the report by KPMG would reduce economic growth for the first three years after the reform.
It is well known that one of the short term effects of an overall rise in consumption taxes is that the economy slows, due to the impact of higher prices (just ask the Japanese). To be precise, it increases household consumption in the years between announcement of the reform and implementation as people rush to buy good at existing prices, then reduces it).
3. Abolishing inefficient State taxes would boost growth in the long run
It’s not surprising the modelling finds that GDP would grow faster over the long term if these taxes were abolished. Taxes such as Stamp Duties have well known negative impacts on investment and growth. Taxing business ‘inputs’ rather than final income or consumption or assets such as land and mineral wealth is inefficient as it distorts household and business investment decisions (for example by discouraging people who need it from taking out insurance, and penalising decisions to move house).
The $27.5 billion dollar question is: by how much? This is notoriously difficult to estimate. As with all macro-economic modelling, results depend on assumptions. The report appears to take this a step further by assigning the projected economic efficiency gains to households (which no Government would be brave or foolish enough to do).
4. Low income households don’t usually benefit from tax cuts
One quarter of households, including the vast majority of those in the bottom 20%, pay no income tax (but they do pay consumption taxes), so they would be worse of in the absence of social security payment increases if consumption taxes increased.
As the above ACOSS report argues, relying on social security payment increases to sustain spending power is risky in an environment when these payments are under threat (see last year’s Budget)
What’s not clear
1. Why do all households gain from revenue-neutral tax reforms?
All four proposals are revenue neutral. They neither increase nor reduce taxes overall. So in the short term, reform is a zero sum game with winners and losers. Yet all households appear to win in the modelling.
A close look at Appendix ‘C’ shows that his happens because of a line item called ‘increase in income before tax’. Why would income increase before tax (apart from social security payments increases which are accounted for separately)?
One possible reason is the claimed ‘efficiency dividend’ from the reform. That is, the economy grows more quickly because taxes are less distortionary. But that’s a long term impact. As indicated, the model shows that GDP growth slows for the first three years and household consumption is projected to fall for the first five years.
If ‘input taxes’ (such as Stamp Duties) are replaced by a tax on consumption (like the GST) we would expect households to be slightly worse off in the short term, in the absence of compensation. This is because in the short term, some of the gains from abolition of input taxes would ‘leak’ to sectors other than Australian households (especially exports).
2. What happens of we exclude ‘increases in income before tax’ and focus on the impact of the tax changes?
If we separate out the effects of tax and social security changes (higher GST, lower Stamp Duties, and income tax cuts and social security increases) from the projected ‘increases in income before tax’ we find that the first reform option (removal of GST exemptions, abolition of some Stamp Duties, a reduction in the first marginal tax rate from 19% to 18.5%, and modest social security increases) reduces household spending power for the bottom 2 quintiles and raises it for others.

This is the pattern of short-term winners and losers we would expect from such a change (red bars), though the average losses at the bottom end are much larger than expected:
- Low income households are disproportionately affected by the consumption tax changes
- Since only the lowest marginal income tax rate is cut, middle income households gain the most, but high income earners also gain because the tax cuts flow through to them as well.
When the ‘increases in income before tax’ are added in (blue bars) everyone wins and the reform is distributionally neutral (see Figure 3-4 in the report).
But where do these income increases come from? The report refers to ‘increased incomes as a result of improved efficiency in the economy’ (p14). If this is where they come from (and these look like brave assumptions), how would these efficiency gains flow through to households in the first year of the reform (2015-16)?
3. What is the effect of the consumption tax changes on their own?
It would be worth knowing what the effect of replacing Stamp Duties with a higher GST has on the spending power of households at different income levels, since this kind of reform is rarely modelled. The impacts are not obvious since Stamp Duties themselves largely fall on household consumption – so the reform would replace one set of regressive taxes with another. Its effects would depend on the spending patterns of different households (e.g. on food, home purchases, car purchases, insurance, etc).
It’s good to see more information out there on the impact of different tax reforms, and it would be even better if some of the results in the report were explained more fully.

The ‘size of Government’ obsession
This week, the PM suggested we do what the New Zealanders had done and put a cap on the size of the Federal Government.
‘And one of the points that I made in my speech to the Press Club last week is that if you look at what New Zealand did with fiscal consolidation, they had a very tight clamp on new spending. They didn’t engage in big cuts. They had a tight clamp on new spending and New Zealand has got government, as a percentage of GDP, from 35 per cent to 30 per cent – a very big change in just a few years.’
The suggestion is that rather than change the direction of policy (by raising taxes or cutting spending more fairly), the Budget will just move more slowly in the same direction, or perhaps not at all! With no steering, no acceleration and no brake, there’s not a lot of room for the next Budget to move. Might as well garage it for a year and avoid the political angst!
Let’s set aside the important question of whether the Budget should stimulate the economy or consolidate public finances (last year’s Budget struck a sensible balance on that score – the big cuts were postponed to future years, but the recent RBA decision to cut interest rates shows that circumstances have since changed for the worse).
The-not-so hidden assumption behind the PM’s statement, and last year’s Budget, is that smaller Government is better. That’s why all of the action in last year’s Budget was on the spending side. Given the targeting of most public spending in Australia, that almost inevitably means the Budget was a regressive.There’s not much room for large cuts outside social security, health and education.
Yet, as ACOSS argued in its Commission of Audit submission in 2013, most of the damage to the Budget bottom in recent years came from sliding revenues, not higher expenditures.
There’s on old neo-liberal economics argument that smaller Government is better for long term economic growth (setting aside any temporary economic stimulus) because taxes and spending dampen and distort market signals in the economy.
In the same submission, ACOSS addressed this issue by dipping into what economic research said about the size of Government and economic growth. It turns out that that there is a (loose) association between size of Government and economic growth, though it is hard to clearly identify the impact of public spending and taxing given all of the other factors that determine long term growth levels. There’s also the problem of reverse causation: the slower the economy grows, the higher is public spending on unemployment and other benefits.
But the real story is not about the quantity of public spending and taxing, it’s the quality that matters for long term growth. Some forms of spending, such as public infrastructure investment, are more growth enhancing than others. Countries that achieve their social goals in a cost effective way are also more likely to be rewarded with stronger economic growth.
The size of Government is mainly a political (and ideological) decision, not an economic one.
Here’s an extract:
ACOSS Commission of Audit submission (2013)
Appendix 5: The ‘size of Government’ and economic growth.
The effect of the size of public revenues and expenditures on long term productivity and economic growth has been vigorously debated for many years. In studies exploring this relationship, ‘size of Government’ is usually proxied by public revenues (or tax revenues) or public expenditures as a proportion of GDP. Early studies suggested that there was an optimal size for Government, above which future economic growth would be constrained.43 A number of subsequent empirical studies of the public revenues and expenditures and economic growth have found that higher revenues and expenditures are associated with slower long-term growth in wealthy countries.44
However, it does not follow from a simple association between Government size and economic growth that one ‘causes’ the other. There are four problems with this apparently ‘simple’ story:
1. The character of public spending and taxes may be as important as its ‘size’. Studies have found that pubic investment in physical infrastructure and human capital development (education) are positively associated with economic growth. Much of what is usually classified as ‘social expenditure’ promotes employment participation and productivity. More broadly, the efficiency of the public sector matters.45
2. Whether or not the size of Government has an impact on economic growth, other policies may have a countervailing effect. While long term economic growth rates have been stronger in recent decades in the Anglo-Saxon countries (which have below average tax levels) than in continental Europe (with above average tax levels), the Nordic countries have both high tax levels and high long term economic growth rates (see table below). One suggested explanation is that the economic openness of the Nordic countries more than compensates for their relatively high tax and expenditure levels 46 .
Tax levels and growth in three types of welfare systems
| Country group | tax to GDP ratio (%) | Average annual real GDP growth (1995 to 2004 – %) |
| Nordic | 45.7% | 2.5% |
| Anglo-saxon | 31.6% | 2.3% |
| Continental European | 38.8% | 1.5% |
Bergh & Henriksen, 2011, ‘Government Size and Growth: A Survey and Interpretation of the Evidence’, Research Institute of Industrial Economics, IFN Working Paper No. 858, 2011 Stockholm.
3. Causation may be in the opposite direction. For example, slower long term growth rates in many continental European countries may be associated with higher unemployment rates (which increase the cost of unemployment benefits) or older populations (which increase the cost of pensions and health care services).
4. In any event, Australia, which is the third-lowest spending country in the OECD, and has a relatively cost efficient social security system and human services, has considerable room to move before higher public revenues and expenditures put a brake on economic growth.
43. For example, Barro 1990, ‘Government spending in simple model of endogenous growth’, Journal of Political Economy Vol 98, No5.
44. Bassanini and Scarpetta 2001, ‘The driving forces of economic growth’, OECD Economic Studies No 33.
45. Angelopoulos et al 2008, Does public sector efficiency matter? Revisiting the relation between fiscal size and economic growth in the world sample, Public Choice, Springer, vol. 137(1), pages 245-278
46. Bergh & Henriksen, 2011, ‘Government Size and Growth: A Survey and Interpretation of the Evidence’, Research Institute of Industrial Economics, IFN Working Paper No. 858, 2011 Stockholm

A brief history of tax (Part 1) Income tax, the great leveller.’
‘The tax code, once you get to know it, embodies all of the essence of life: greed, politics, power, goodness, charity. Everything’s in there.’ Sheldon Cohen, Former Commissioner of the IRS.
Tax reform is back on the agenda. Since those who fail to study history risk repeating it (and I was involved in the latter-day history of tax reform) I’m writing this 3 part series as a guide for people who want to become involved in the next phase. I begin with a short history of the dominant tax of the second half the 20th century – personal income tax.
To keep it simple, I’ll focus on some of the big debates over the goals of tax reform and how the system should be restructured to achieve them. Readers with an interest in detail can buy a book, such as Julie Smith’s excellent ‘Taxing Popularity’ (a history of Australian tax policy to 2004) or Slemrod & Bakija’s ‘Taxing ourselves’ (MIT Press 2008 – a beginners guide to tax policy from the US); or turn to the ‘Henry’ Report’s Architecture of the Australian Taxation System . Those wanting to keep up with current Australian tax debates should visit the Tax Watch site.

For most of the second half of the 20th century, the income tax was king. It raised over half of all public revenue in Australia. In the eyes of its supporters it was a benevolent king because it taxed fairly.
What’s income?
Income is a surprisingly slippery concept. The first step in taxing it was to define it. One of the earliest definitions came from Robert Haig:
‘ the money value of one’s net accretion to one’s economic position between two points in time.’ Haig, R (1921) The Federal income tax, New York: Columbia University Press, p27.
In plain language, income is ‘spending power’. A decade and a half later Simons refined Haig’s definition – as the sum of (1) consumption of goods and services in the market and (2) the change in the value of personal wealth in any period. The second part of this equation is the basic difference between a tax on income and a tax on consumption – unlike a consumption tax, an income tax captures the annual returns from that part of income which is saved and invested.
Most people associate income taxes with deductions from their fortnightly pay, yet income has many other guises: interest, dividends, capital gains (the annual change in the value of an investment asset such as shares or property), and ‘imputed rent’ from housing (the annual rental value of the housing ‘services’ you receive when you own your home). A ‘comprehensive income tax’ taxes all of these items at the same rates. All of these items reflect changes in an individual’s ‘spending power’. Note that an income tax is also different from a wealth tax (including taxes on land), which taxes the stock of an individual’s wealth rather than annual changes in its market value.
To illustrate the difference between spending and spending power, let’s compare two people who each spent $50,000 last year. One had an income of $50,000 and spent all of it on regular living costs (as around half of all Australian households do). The other had income of $70,000 and saved $20,000 for a home deposit. She was in a stronger economic position because she had an extra $20,000 and could choose to spend it now or save to improve her future spending power. The difference between income and spending is, of course, saving. It’s all a matter of timing – people either spend their income now or save in order to defer their spending.
Why tax income?
For Haig, the purpose of income tax was to tax people more precisely according to their ability to pay, and their spending power was the best way to measure this. (this is hotly debated by advocates of a shift towards consumption taxes, on which see Part 2). This was the ‘soft’ version of the purpose of income tax. The ‘hard’ version was enunciated by Henry Simons at the tail end of the Great Depression. He argued that its purpose was for:
‘altering or correcting the distribution of wealth and income’. Simons H (1938), ‘Personal income taxation: ‘The definition of Income as
a problem of fiscal policy,’ Chicago: University of Chicago Press, p15.
Despite the sharp political divisions at this time – US President Roosevelt announced at a public rally that he ‘ate capitalists for breakfast’ – the hard version was not the main motive for the dramatic increases in income tax over the next decade. Income taxes were used to fund two world wars.
Income tax and war
As in the US, the first national income tax was introduced in Australia to finance the war effort (the First World War, that is, in 1915). At the time most public revenue came from customs and excise duties – taxes on consumption. These fell on unemployed people and pensioners as well as wage earners, and low paid workers as well as high income earners. Economic divisions were much sharper than than now: unemployment was high and most wages were close to subsistence levels. The vast bulk of private investment income went to a wealthy minority. The new income tax was not consciously used by the Hughes Government to redistribute income, but in financing the war it could not ignore the economic inequalities and social tensions of that era. It was time to shift some of the tax burden to those with higher wages and income from investment.
The first national income tax included investment income, it had steeply progressive marginal tax rates and it wasn’t levied at all on the majority of wage earners. It was accompanied by federal taxes on undistributed company profits, land and inheritances. A country which previously had one of the most regressive tax systems in the western world (that is, one in which effective tax rates are higher for low income earners than for high income earners, in proportion to their incomes) now pioneered an income tax with multiple rates. But to put this in context, Federal and State income taxes together raised less than 10% of all public revenue.

The next step was a dramatic rise in federal income tax revenues in the early 1940s to fund the second (world) war effort and the extension of social security entitlements to unemployed people. There was also a push to centralise income tax in the hands of the Commonwealth to facilitate economic management (State income taxes preceded the national one). Low paid workers were income-taxed for the first time but ‘unearned’ income from property was taxed at higher rates than wages. By the late 1940, income tax raised more than half of all public revenue.

The income tax scale was steeply progressive: for much of the post-war period, the top personal tax rate was over 60% and the company tax rate was over 40%.
Income tax as a leveller
There can be little doubt that the personal income tax redistributed income on a large scale, whether that was its purpose or not. One of Picketty’s main conclusions in his magnum opus Capital in the 21st Century was that the expansion of income taxation in wealthy nations from WW1 on was a major cause of the decline in income inequality over the next 50 years.

This graph shows the typical pattern of income inequality in wealthy countries over the second half of the 20th century, in this case among Australian males (old data are all too often male!), from Andrew Leigh’s research. Inequality moved over this period in a ‘U’ shape curve, higher in the ’40s, falling to a low point around the late ’70s, then rising steadily. [The higher the ‘gini coefficient’, the more unequally distributed income is – if the gini has a value of 0 all income is shared equally, if it has a value of 1 all income is held by one person.]
You can also see from this graph that the income tax system (the only taxes in Leigh’s data) reduced inequality among Australian men by about one quarter between the ’40s and the ’90s. If the same data were available for the first half of the century, they would show a much smaller impact since the income taxes themselves were much smaller. Inequality of private incomes was also greater at the turn of the 20th century.
Another way in which high top tax rates might reduce inequality is through behavioural effects. Picketty argues that confiscatory tax rates on very high incomes after WW2 discouraged employers from paying high wages in the first place, and indeed growth in top wages moderated during and after the war.
Causation also worked in the opposite direction: growth in income taxation was part of a wider push to temper the harsh inequalities and suffering of the great depression and to ‘win the peace’. The rise in Australian income tax in 1944 was to pay for social security for unemployed people and widows. Full employment was enshrined at the centre of economic policy. Minimum wages rose and unions grew stronger. All of these factors contributed to the reduction in inequality from the 1940s to the 1970s. Then public policies began to swing in the opposite direction.
War on income tax
The equalising effect of personal income tax declined from the 1980s as the tax rate scale became less progressive (redistributive), and then as the overall size of the personal income tax was reduced through eight annual tax cuts during the 2000s. This has been the trend across many OECD countries (see below).

In the 1970s and ’80s, the income tax system fell out of favour with policy makers and sections of the public. This was part of wider shift in the policy zeitgeist from reducing inequality to removing constraints on economic growth. It was also due to serious flaws in the income tax system itself which were exposed at a time when inflation averaged over 10% per year. People were moving rapidly into higher tax brackets, and those in the top brackets were making greater efforts to avoid tax. One prominent national daily newspaper declared a ‘tax revolt’. The king seemed to have lost his clothes!
‘Increased revenue demands are being placed on a system that contains some basic structural flaws and a tax base that has been whittled away through special concessions and tax minimisation arrangements. The system has been criticised by officially commissioned inquiries, (including the Asprey, Mathews, and Campbell Committees), academics, the media and, increasingly, the general public. The system’s basic unfairness, its complexity, and its adverse effects on incentives to work, save, invest and take risks are widely recognised. In short, respect for the system, which is essential for voluntary compliance, has been seriously undermined.’ (Australian Government (1985), Draft White Paper: Reform of the Australian Taxation System, p18)
In the 1970s the Asprey Report diagnosed the problem as an engineering fault: tall tax rates were built on a narrow foundation and the building was at risk of collapse. It advocated a trade-off between a ‘broader tax base’ (the removal of shelters and loopholes) and lower rates. Crucially, this was argued on economic efficiency as much as equity grounds. The tax system was distorting investment decisions (for example the lack of a tax on capital gains encouraged speculation in asset values, especially housing) and labour force participation (due to high marginal tax rates).
Mathews argued that inflation was white-anting the tax system and the best way to bring it back into equilibrium was to adjust income tax thresholds and investment returns for inflation. The latter idea was consistent with the original theory of taxation of investment income, that only ‘real’ (after-inflation) returns should be taxed. Asprey and Mathews didn’t want to bury the income tax, they wanted to save it. Mathews famously argued that the challenge was:
‘not to make the rich pay higher rates of tax, or even more tax, than the poor; it is to make the rich pay any income tax at all.’ Mathews R (1981), ‘The structure of taxation’.
These reports gathered dust until a Royal Commission was established into a very different matter: the activities of the Ship Painters and Docker’s Union. The Fraser Government forgot the first principle of public inquiries – don’t set one up unless you already know the outcome! What started as an inquiry into the nefarious activities of a trade union became a public airing of tax evasion at the top end of town. Investment income and profits were stripped from companies before tax was payable and company records were sent to ‘the bottom of the harbour’. This was the last straw for many ordinary wage earners, whose tax rates rose all too frequently as inflation pushed them into higher tax brackets.
RATS save the ship
The income tax was finally patched up in 1985 following the Hawke Government’s Tax Summit. This was a time when different sectors of the community – unions represented by the ACTU, the community sector by ACOSS, and major business organisations – were encouraged by Government to come together to tackle the big problems of the day. It was no coincidence that this was also a period of sweeping economic and social reform.
The Treasury released a Draft White Paper called ‘Reform of the Australian Tax System’ (RATS). Thus began the tradition of applying animal names to tax reforms. This one may have been borne of frustration – Treasurer Keating’s preferred ‘Option C’ which included a ‘broad based consumption tax’ (another recommendation of the Asprey report) was dropped (more on this in Part 2).
The RATS package attempted to seal the four main ‘cracks’ in the income tax system (see Rick Krever’s summary of the package and its origins).
First, the different tax treatment of capital gains (which were largely untaxed) and other investment income: A Capital Gains Tax was introduced on increases in the value of assets such as shares and property (but not the main residence), after taking account of the effects of inflation (but inflation adjustment was not extended to other investments as Mathews proposed so investments were still taxed inconsistently).
The second problem was related to the first: the mismatch between income and deductions in ‘negatively geared’ property investments. Real estate investors structured their affairs so that annual investment expenses (e.g. interest payments on debt) exceeded returns (e.g. rents) for a number of years before the property was sold, yielding a low-taxed capital gain. The problem for the fisc was that these ‘losses’ were deducted against other income (e.g. wages) which were taxed every year at higher rates than capital gains. There was a mismatch between the timing and the level of income tax and related deductions.
Third, a Fringe Benefits Tax was introduced to capture income in the form of goods and services provided in lieu of wages, such as company cars (but not discounted shares and options).
Fourth, inconsistencies in tax rates applying to individuals who used different business and investment structures were tackled. It was argued that as long as the company income tax rate was less than the top personal tax rate, high income-earners could shelter their income in a private company. This problem was resolved a few years later when the company tax rate was increased to the same as the (lowered) top personal tax rate, but this alignment of the two tax rates only lasted a few years.
The tax bias in favour of diverting income into private discretionary trusts also attracted attention. This problem would be partly resolved by reducing the value of the tax breaks (such as building depreciation) that flowed through to the beneficiaries of these trusts. This reform, which brought their tax treatment more closely into line with that of companies and fixed trusts, was later reversed on a legal technicality and the use of private discretionary trusts to avoid tax continued apace.
The RATS reforms were vigorously opposed amid warnings that the sky would fall in on business lunches, the car industry and rental property investment. While it’s true that the ‘abolition of negative gearing’ for rental property introduced a tax bias against borrowing for housing investment relative to other investments (e.g. borrowing to buy shares), the claim that it decimated rental property investment was false – investment only declined in Sydney and Perth and the main reasons for this were interest rate increases and a sharemarket boom (see Badcock & Browett (1996), ‘The responsiveness of the private rental sector in Australia to changes in Commonwealth taxation policy’). Despite this, this federal tax reform was reversed during a hard fought NSW election campaign, to avert a scare campaign over rent increases.
As it turned out, the sky remained in its place, the restaurant industry prospered and the car industry continued to post losses as it had for some time. The reforms were widely accepted because the the majority of taxpayers received tax cuts at the expense of the minority who previously benefited from tax shelters. The top tax rate fell from 60% to 49% but more high income-earners would at least pay the 49%. In one swoop, RATS attacked the two main public complaints about the income tax.
A startling fact about the RATS reforms was that their logic – to ‘broaden’ the tax base and lower rates – was identical to a simultaneous tax reform in the US authored by the Reagan administration. Like Keating, Reagan was determined to cut income tax rates, including the top rate. His problem was that after he cut tax rates dramatically in 1981 the US budget fell into deficit (contrary to the theory that lower tax rates might increase revenues, promoted by economist Arthur Laffer). If he was to cut income tax further he would have to find a way to pay for it. The solution proffered by the US Treasury was the same as its Australian counterpart: close or restrict tax shelters. The US Capital Gains Tax was increased, negative gearing was restricted, and depreciation allowances for business were cut. Reagan’s political strategy was the same as Keating’s – those who opposed the removal of tax shelters would be accused of standing in the way of tax cuts for the majority. The story of this hard-fought battle for tax reform in the US is detailed in Birnbaum & Murray’s entertaining and informative ‘Showdown at Gucci Gulch’ [Gucci Gulch was the area outside a certain Senate Committee room where tax lobbyists gathered].
The king faces a challenger

While many gaps remained in the income tax – including those that were re-opened following the retreats on negative gearing and discretionary trusts – it remained the pre-eminent Australian tax. Yet by the end of the 1980s the income tax still faced challenges on two fronts. It was under siege politically due to its high visibility and the general retreat from inequality-reducing policies. It was also threatened intellectually by a new challenger, the broad based consumption tax. The battle of ideas often precedes the political one, and so it was with tax policy. The idea that the income tax should be replaced by a tax on expenditure was first advanced in the 1940s. This is the topic of Part 2 of the Brief History of Tax, the Clash of the Titans.
Brief History of Tax, Part 2: Clash of the Titans
‘The tax code, once you get to know it, embodies all of the essence of life: greed, politics, power, goodness, charity. Everything’s in there.’ Sheldon Cohen, Former Commissioner of the US Internal Revenue Service.

A brief history of tax (Part 2): Clash of the titans
Tax reform is back on the agenda. Since those who fail to study history risk repeating it (and I was involved in the latter-day history of tax reform) I’m writing this 3 part series as a guide for those involved in the next phase. Part 1 dealt with the dominant tax of the second half the 20th century – personal income tax. This part describes the intellectual and political contest between taxing income and consumption over the last four decades: a clash of tax titans.
Readers with an interest in detail can check out the references in Part 1 of this blog. In addition, good summaries of the arguments for and against a switch from taxing income to taxing consumption are provided by Brooks, Auerbach, and Henry. Those wanting to keep up with current Australian tax debates should visit the Tax Watch site.
Re-capping the income tax story
By the 1970s the income tax was ‘king’. Personal and company income taxes raised the majority of public revenue in Australia. Income tax was a key tool for redistributing resources from those with the greatest ability to pay – those with higher incomes – towards those with the least. Elite and public support for income tax faded during the 70s and 80s for a complex set of reasons: inflation was moving ordinary wage earners into higher tax brackets while high income earners could readily avoid paying tax. At the elite level, redistribution was out of favour as wealthy nations grappled with the failure of the post-war economic model to deliver steady growth in living standards. The neoliberal view – that these problems could only be resolved if constraints on the free operation of markets were removed – gained traction.
One of the constraints identified at this time was the income tax system, which distorted saving and investment decisions (these were too often made for tax reasons rather than to achieve the best returns) and discouraged workforce participation. These economic efficiency concerns carried more weight in tough economic times.
They did not necessarily conflict with equity concerns. Neoliberal economists were among the strongest supporters of a comprehensive income tax – one which taxed all forms of earned income and investments consistently. That meant the removal of tax shelters and loopholes which mainly benefited people with high incomes. The major Australian tax reviews in this period advocated the perfection of the income tax model, not its abandonment.
Yet there was an alternative to reconstructing the income tax. The Hawke Government’s 1984 ‘Draft White Paper’ on Tax Reform advanced three options: Option A cut income tax rates by closing tax shelters, Option B added to this reform the replacement of a ramshackle set of federal sales taxes with a broad based tax on consumption. Option C went a step further by increasing the proposed consumption tax to pay for deeper income tax cuts. Option B was an internal clean-up of consumption taxes. Option C had the more ambitious aim of changing the mix of taxation from income to consumption, or expenditure.
While it only came into prominence in Australian public debate in the 1980s, the idea that a broad based tax on consumption was superior to an income tax had deep historical roots. At its core, this was an argument about the tax treatment of saving and investment.
The expenditure tax alternative
‘The Equality of Imposition consisteth rather in the Equality of that which is consumed, than of the riches of the persons that consume the same. For what reason is there, that he which laboureth much, and sparing the fruits of his labour, consumeth little, should be more charged, than he that living idlely getteth little, and spendeth all he gets: seeing the one hath no more protection from the Commonwealth than the other? But when the Impositions are layd upon those things which men consume, every man payeth Equally for what he useth: Nor is the Common-wealth defrauded by the luxurious waste of private men.’ Hobbes Leviathan Ch. XXX. (from Kaldor, see below)
Hobbes’ 17th century ‘moral’ argument for taxing expenditure instead of income seems curious today since the purpose of saving is to make room for more spending later on. If we all ‘consumed little’ the economy would grind to a halt.
The modern-day case for taxing expenditure instead of income was first advanced by an American economist, Irving Fisher in 1942. This argument would rage among tax experts, out of earshot of the general public, for the next half century and beyond.
Fisher’s case for a tax on expenditure seems far removed from Australian public debate over sales taxes like the GST. Yet it is about the same issue: how savings should be taxed.
Just as the top income tax rate in the US reached its zenith (a top marginal rate of 80%) during World War 2, Fisher proposed an alternative, the spendings tax. Fisher’s main objection to the income tax was that it unfairly penalised saving since (as I pointed out in Part 1) it taxed investment income as well as wages and this amounted to ‘double taxation’ of savings. His solution was to remove the taxation of investment income by taxing cash-flows instead of income.
To simplify, the tax base would be the difference between cash on hand at the beginning of the year together with wages and cash income from investments accrued during the year, and cash remaining at the end of the year. The difference was the amount spent during the year. His proposed ‘spendings tax’ was actually a tax on consumption (income minus saving), but unlike sales taxes it would be raised directly from the taxpayer rather than indirectly from retailers (who then pass it on to the consumer).
The above quote from Hobbes was the opening page of Nicholas Kaldor’s book ‘An expenditure Tax’, published in 1955. Kaldor brought the idea of replacing the income tax with a tax on expenditure to the United Kingdom. This idea gained greater prominence after the release in 1978 of a landmark report by the Institute for Fiscal Studies, the ‘Structure and reform of direct taxation’. The report, prepared by an expert committee headed by James Meade, argued for replacement of the income tax with a ‘progressive expenditure tax’:
‘A progressive expenditure tax is the one form of tax which could have the political appeal of encouraging enterprise and economic development and at the same time heavily taxing high levels of consumption expenditure which at present, if it is financed out of capital, goes untaxed.’ p33
Equity and efficiency arguments
These were bold claims, and they conflicted with the common sense view that taxes on consumption were regressive. Meade and other expenditure tax advocates were not arguing the community should accept a less equitable tax system in order to promote economic growth. They were saying we could have our proverbial cake and eat it, too.
The equity case for progressive income taxes rests on two main arguments: that they tax individuals directly at progressive marginal rates and that income is a better measure of the resources available to people than consumption.
By contrast, existing consumption taxes were imposed ‘indirectly’ as sales taxes on retailers and not ‘directly’ on consumers. This meant that they ignored differences the overall level of consumption among people of different means. It was not possible to tax consumption at progressive rates using a sales tax (this could only be done imprecisely by taxing luxuries at higher rates).
Fisher, Kaldor, and Meade’s solution to this problem was a ‘direct expenditure tax’. Instead of taxing consumers indirectly via retailers, they would be taxed directly on their consumption. This could be done by converting the income tax into a tax on spending. The key was to remove from taxation that part of income which is saved. Meade described a number of ways in which this could be achieved. One option was to deduct from tax any amounts saved during the year (e.g. outlays on new investments or repayment of loans). Another option was to exempt investment income (such as interest and dividends) from tax. These changes would be coupled with the taxation of any reduction in savings as they were drawn down to be spent (as superannuation benefit payments were previously taxed in Australia). Since each individual would be taxed directly on their income minus amounts saved, tax could still be levied at progressive rates.
This focussed debate on the real difference between taxing income and consumption – the tax treatment of savings. The equity case for income taxes rests on the idea that income or ‘spending power’ is a better measure of ‘ability to pay’ than expenditure because the ability to save and invest part of our income enlarges life choices (for example, to improve housing security by buying a home). Consumption tax advocates put the contrary view: that spending is a better measure of access to resources and that by taxing the returns from saving, an income tax favours current spending and penalises future spending.
A related argument is whether ‘ability to pay’ is best measured each year, or across the life course. An annual measure favours income taxes (since income taxes impact less on people whose ability to save is constrained), whereas consumption tax advocates argue that their tax is fairer on a lifelong basis (since income must eventually be spent and it is best not to interfere with people’s choices to save and defer their spending). Of course, not all income is spent during our lifetimes: many people leave part of their wealth to the next generation. To deal with the equity objection that taxation of savings could thus be deferred indefinitely, consistent expenditure tax advocates (including Meade) argue for taxes on gifts and inheritances.
A key question from an equity point of view is whether people who are relatively well off derive more benefit from a tax system that allows them to defer taxation on income from their savings until they spend it.
Key issues from an economic efficiency point of view are which of these two tax bases have the least adverse impact on saving, investment, and workforce participation, with a minimum of distortion of decision-making in each of these areas.
I’ll deal with these issues in a separate blog: ‘Who’s the fairest (and most efficient) of them all?’ For now, let’s turn to how the clash of these two tax titans – income and consumption taxes – was resolved in Australia and other wealthy countries.
The tax mix hasn’t changed much at all

If we take a virtual trip to Cabarita Beach in northern NSW, we’ll find this sign:
‘Historic site: At this precise point, on the morning of December 12 1927, nothing of significance is known to have occurred.‘
The outcome of the argument over the optimal tax mix feels a bit like this.
On the face of it, 40 years of fierce intellectual and political argument over the ideal tax mix has had little impact on the balance between income and consumption taxes in wealthy countries. What it has achieved is a more nuanced view of the taxation of income and savings, informed by a substantial body of research.

The share of consumption taxes in public revenue of OECD countries (top line) fell during the 1970s and has been stable since. This is the result of two conflicting trends: a decline in customs duties and taxes on specific goods offset by a rise of broadly based ‘value added taxes’ such as Australia’s GST.
The revenue share of income taxes also remained stable, but this masked major changes in the composition of taxes on income.

The key change here over the last 40 years was a reduction in the share of personal income taxes (top line), offset by a rise in social security taxes (second line). These taxes, used in Europe and the US to finance social insurance payments, are usually raised at a flat rate.
This change, along with less progressive income tax rate scales, reduced the progressivity of income taxes. Interestingly (given arguments that company income taxes would be competed away), the share of corporate tax revenues (bottom line) remained stable, even rising in the 1990s.
Enduring differences in the tax mix among countries
There are enduring differences in the tax mix and revenue ‘take’ between the Anglophone countries and most of Europe. The Anglophone countries raise less tax overall but do so more progressively, with a greater reliance on progressive income taxes. Most European countries raise more revenue, but rely less on income taxes and more on consumption or social insurance taxes to do so.
As shown in an OECD analysis, these international differences reflect different strategies to redistribute income in European and Anglophone countries. Across northern and central Europe, generous social insurance payments for retirees, people with disabilities and unemployed people play a major role. These require much higher taxes, and European countries are more tolerant of less progressive tax systems as long as they raise the revenue needed for these and other social programs. Australia, the US and Canada have more parsimonious social security systems and their electorates are more sensitive to any reduction in the progressivity of the tax system. This reflects the Anglophone emphasis on ‘targeting’ of both benefits and taxes to achieve distributional gaols with smaller welfare systems.
An exception is New Zealand, where social security payments are low and Governments have reduced the progressivity of the tax system by cutting top marginal tax rates and increasing the GST. New Zealand Treasury analysis found that recent changes along these lines in 2010 had little impact on the real disposable incomes of households on less than $NZ20,000 but boosted those of households earning over $NZ200,000 by an average of almost 3%. Tax policy changes along these lines, together with radical deregulation of the labour market, have led to one of the largest increases in income inequality among OECD countries over the last 30 years, with the gini coefficient rising from 0.27 (well below the OECD average) to 0.33 (slightly above it).
What happened in other countries?
In Europe, the major change to consumption taxes since the 1970s was the increased use of broad-based Value Added Taxes (like our GST, these tax the increase in the value of a product at each stage of its production and sale, offset by refunds for the cost of inputs). But the replacement of narrowly based consumption taxes and customs duties with VATs was part of a European Union push to modernise and standardise consumption taxes. It was not an attempt to replace income taxes.
The introduction of VAT by the Thatcher Government in the UK followed this logic. The Meade Report was not well received by her Ministers, who were wary of his proposed gift and inheritance tax and believed an incremental approach to tax reform was more likely to succeed than replacing the income tax with a new tax on expenditure. Its main influence on tax policy in the UK was the introduction of tax relief for long-term saving (for example through Tax Exempt Savings Accounts or TESSAs).
There was little interest among countries with the greatest reliance on consumption taxes to increase it further. Instead, the push for taxing consumption more and income less came from a country where consumption taxes were low: the US. This idea was called was called ‘fundamental tax reform’ – and there was an air of fundamentalism about it:
‘I strongly believe that Congress should abolish the income tax system in its entirely and begin anew. A single rate consumption tax on goods and services is the fundamental change needed to spur economic growth and increase wages, saving and investment. Our intrusive tax system should be transformed to one that is fair, transparent and friendly to savings and investment. A sales tax would achieve these goals and allow us to abolish the IRS. Every dollar the American people earn would be theirs to save, spend or invest. They would not have to account for it or face intrusive audits. They could pass it along to loved ones without strings attached.’
Senator Lugar, January 20, 1999 press release.
Proposals to replace US income taxes with a federal consumption tax have not centred on sales taxes like the Australian GST, perhaps because the US States already have sales taxes of their own. In 1977 the US Treasury, in its ‘Blueprints for Basic Tax Reform‘, proposed a progressive expenditure tax similar to Meade’s proposal. This would have been levied at progressive rates, and would have replaced the federal income tax. It would have exempted income from investment and taxed withdrawals from savings accounts. Business would be taxed on cash flow rather than income. ‘Blueprints’ also raised an alternative option – a more comprehensive income tax – and this proposal (not the progressive expenditure tax) was the launch pad for the Reagan tax reform a decade later (discussed in Part 1 of this series).
‘Blueprints’ was followed in 1983 by the ‘flat tax’ proposed by Hall and Rabushka, a tax on business cash flows coupled with a flat tax on wages above an annual threshold. Not surprisingly, this was widely opposed on equity grounds with studies finding it would increase inequality in both the short and long term.
In 1985 Bradford proposed his ‘X Tax’. This was similar to the ‘flat tax’ except that wages would be taxed at progressive rates and business cash flow would be taxed at the top personal tax rate. The ‘X Tax’ was clearly more progressive than the ‘flat tax’ but as with other expenditure taxes, replacing the income tax with the ‘X Tax’ would have benefited those with the ability to save a large share of their income (who are generally relatively well-off), and devalued the savings of retirees.
The push to replace US federal income taxes with an expenditure tax has been spectacularly unsuccessful. In the absence of a federal sales tax, the US relies less on general sales taxes than virtually any other OECD country. As in the UK, the expenditure tax debate led to new tax breaks for long-term saving, but their impact on household saving levels is disputed.
Fundamental tax reformers in the US over-reached in trying to achieve the toughest goal in tax reform – introducing a completely new tax:
‘Replacing the entire income tax with a consumption tax would be a grand experiment of applying theory to a practical application that no other country in the world has chosen to undertake. Proponents of these plans must, therefore, overcome a significant hurdle – they must show that it is worthwhile to conduct this experiment on the world’s largest and most complex economy.’ (former) Assistant Secretary for Tax Policy, Les Samuels, June 7, 1995 testimony.
What happened in Australia?
The strongest push to raise taxes on consumption here came in 1984 with Treasurer Keating’s ‘Option C’. This would have replaced existing consumption taxes with a broad based consumption tax (GST) at 12.5%, enough to pay for substantial income tax cuts. While not opposed to a GST in principle, both ACOSS (representing the community sector) and the ACTU (representing unions) opposed a large consumption tax due to its impact on the cost of living, and equity. At the national tax summit, business representatives opposed all three options because they were not prepared to support the removal of income tax shelters in ‘Option A’ (which included a Capital Gains Tax and a Fringe Benefits Tax).
Once Prime Minister Hawke realised that none of the key sectors were prepared to support ‘Option C’, he pulled the plug. The income tax reforms in ‘Option A’ were introduced regardless, and used to pay for more modest income tax cuts. The business sector learnt its lesson: following the Tax Summit the CEOs of large businesses established the Business Council of Australia to help it formulate common policy positions to take to Government.
This left the consumption tax base in disarray. The Wholesale Sales Tax only taxed goods and not services, yet services were growing in economic importance. State excise taxes on petrol, alcohol and tobacco were later struck down by the High Court on constitutional grounds, and many of the other State indirect taxes, especially Stamp Duties, were widely regarded as economic inefficient. Along with the US, Australia was one of the few OECD countries without a broad based tax on consumption.
The next attempt to introduce one was a crazy-brave push from Opposition in 1993 by the Coalition Parties led by John Hewson. His ‘Fightback’ package would have progressively replaced industrial awards with individual contracts, abolished Medicare, placed time limits on unemployment benefits, and introduce a Goods and Services Tax. Coming after a recession when people craved economic security, ‘Fightback’ scared voters and the Labor Party won the election.
Hewson’s proposed GST rate was 15% and this would have funded a 30% reduction in income taxes as well as replacing existing consumption taxes (since the GST would have replaced State Payroll Taxes as well as the Wholesale Sales Tax, the proposed change in the tax mix towards consumption was not as large as ‘Option C’).
The Howard Government learnt its lesson from the ‘Fightback’ experience. Its attempt to introduce a GST started in 1996 with a two year period of public discussion over the state of the tax system and options for reform. This discussion was led by an unusual combination of business organisations (the Australian Chamber of Commerce and Industry and BCA) and the community sector (represented by ACOSS). In a departure from previous tax reform efforts, they agreed that the basis for reform should not be a change the mix of taxation between income and consumption. The goal was to broaden both of these tax bases by winding back shelters and exemptions. There was agreement between business and ACOSS that tax avoidance through private trusts should be curbed (as urged by then Tax Commissioner, Michael Carmody), that company car fringe benefits should be fully taxed, and that the consumption tax base should be broadened to services. ACOSS also sought a tightening of Capital Gains Tax and negative gearing arrangements, and reform of superannuation tax breaks. Business organisations wanted food included in any new consumption tax, but ACOSS opposed this since food was about a quarter of all expenditure by low income households.

Modelling conducted for ACOSS suggested that if a GST only replaced existing (narrower) consumption taxes, and food was exempted, the change would have little impact on household spending power, and could easily be compensated through modest benefit increases and tax cuts (not shown here). The impact on the distribution of spending power would have been negligible.
If reform along these lines were implemented, more robust revenue bases would be available for social programs and at least some of the community sector’s long standing proposals to remove income tax shelters would be implemented. Business would achieve the removal of ‘input taxes’ on the production of goods (Wholesale Sales Tax, bank duties, and possibly Payroll Tax). It was in the interest of both sectors that any broad tax on consumption was used for this purpose rather than to pay for income tax cuts – a change that was likely to be regressive.
To strengthen the tax base of State Governments and to make it more difficult for future Commonwealth Governments to raise the GST to finance income tax cuts, ACOSS proposed that all GST revenues be allocated to the States, and that unanimous State and Commonwealth Government agreement should be required to increase it or extend to items such as food or community services. This proposal was adopted. After two failed attempts to introduce a broad consumption tax, the Government knew it had to show the public that the new tax would be difficult to increase later on (even though this constraint was political rather than legislative). It was also aware of the States’ need for a more robust and efficient revenue base.
But the Government had other ideas on the tax mix. Recalling the experience of the Coalition Parties in 1993, when Keating offered the electorate almost the same income tax cuts as the Coalition without a GST, the Howard Government opted for a tax package with a 10% GST with no exemption for food, which would replace some existing sales taxes and pay for large income tax cuts. A crackdown on tax avoidance through private trusts (by taxing discretionary trusts as companies) was included in the package, but motor vehicle industry lobbying prevented the removal of tax breaks on company cars. Following the Australian tradition of animal names for tax reforms, it was called A New Tax System, or ANTS.
ACOSS rejected the Government’s tax proposals, and so did the Senate. Due to the inclusion of food in the tax base and the use of the GST to fund income tax cuts, the Government’s tax reform package would have been strongly regressive despite compensation for low income households (in any event, ACOSS regarded a heavy reliance on ‘compensation’ as too risky for these households). It did little to remove tax shelters that undermined equity as well as distorting investment decisions, and would have resulted in a one-off rise in the cost of living of around 2-4% for households on modest incomes.
Australian Democrat Senators negotiated a less inequitable reform package with the Government, in which fresh food was removed from the GST and the income tax cuts were pared back at the top end. These were sensible changes to improve its fairness and secure public support for reform, and research conducted for a Senate Inquiry into tax reform found that their impact on future economic growth would be minor. Regrettably, the revised package took no further steps to broaden the income tax base. Two thirds of the cost of removing fresh food from the GST was met by keeping regressive State indirect taxes slated for abolition.

The result was a less regressive reform, but a regressive one none the less. This graph shows the results for singles without children. The reform boosted the incomes of most high income earners by around 3%, most middle incomes by around 2%, and most low income households by 0% to 3%. The removal of fresh food from the GST reduced the risk for low income households and the removal of top-end tax cuts reduced the gains for high income earners. Another positive outcome was that the food exemption and increases in family payments particularly benefited low income families – not shown here. (Note that the tax cuts and benefit increases cost more than the rise in consumption taxes, so most households gained in the short term at the expense of the fisc. It’s easy to create winners in this way)
The proposal to tax discretionary trusts as companies was not legislated up front as a condition for passage of the GST. Once the GST became law, the trust reforms withered on the vine. A subsequent business tax review argued for curbs to tax avoidance through private companies but at the last minute it also proposed a widening of the tax shelter for capital gains (by replacing inflation adjustment of capital gains with a halving of tax rates on nominal capital gains). ACOSS warned that this, together with the retention of negative gearing, would fuel the next speculative housing boom.
The outcome in Australia
After two failed attempts to modernise consumption taxes and shift the tax mix from income to consumption, the third attempt was successful. It increased the consumption tax share of overall public revenue by just under 2% of GDP.

Yet over the longer term, the share of consumption taxes in public revenue remained remarkably stable, returning after a decade to the pre-GST level of around 27%, compared with an OECD average of 33%.
Much has been made of the higher share of income taxes (including on companies) in Australian public revenues. In 2012 this was just over 60% compared with an OECD average just over 50%, when social security and payroll taxes are included. Australia’s income tax share of total revenue may be relatively high, but as the fifth-lowest taxing country in the OECD, our ratio of income taxes to GDP (16%) is close to average (15% including employee social security contributions). This is hardly unsustainable. The challenge now, with the federal budget in deficit and the looming costs of an ageing population, is to strengthen public revenue in a way that is both fair and economically efficient.
Conclusion
The 40 year battle between advocates of income and consumption taxes has improved the sophistication of tax policy discussion at the elite level. The tax treatment of saving and investment is now better understood, and policy is informed by decades of careful research. Yet the public is still wary of consumption taxes, and their intuition that these taxes are more regressive than income taxes is pretty accurate (see my next blog ‘The fairest of them all’).
A key problem for advocates of a shift towards taxing consumption is that while the impact of such a change on the distribution of income can be measured reasonably accurately (at least in a single year), its economic impact is harder to quantify. The stability of the tax mix in Australia and other countries suggests that the public have not bought the argument that we would be better off in the long run if we relied more on consumption taxes.
The clash of the titans has aroused passions on both sides, and this in itself has made tax reform more difficult. It may be time to move on.
Many of the economic benefits of a shift from taxing income to consumption could be achieved by reforming the income tax itself. This will be the topic of the final part of this series, ‘The Trojan Horse’.

A brief history of tax (Part 3):
Who is the fairest (and most efficient) of them all?
In my blog series: ‘A brief history of tax’, I describe how after the Second World War the income tax rose to prominence in Australia and other wealthy nations, and how since the 1970s its dominance was challenged by advocates of consumption or expenditure taxes. This blog assess the merits of income and consumption taxation from the standpoints of equity and economic efficiency.
Before we begin, it’s worth making clear the difference between income and consumption taxes. We’re all familiar with the personal income tax on wages, but income taxes also apply to investment income (capital gains, interest and dividends) and to companies and other entities as well as individuals. An income tax taxes increases in a person’s spending power from year to year, whether this comes from wages or an increase in the value of their investment assets (e.g. property or shares).
On the consumption tax side, we’re all familiar with sales taxes such as the GST. Yet there is another kind of consumption tax, one which is levied directly on taxpayers rather than indirectly (the GST, which taxes retailers in order to tax consumers, is an indirect tax). Direct expenditure taxes are relatively unknown in Australia because they have not been used here (or pretty much anywhere). Yet they have long been advocated as a substitute for income taxes. The basic idea is to exempt income from savings (investment returns) from the personal income tax, since the difference between income and saving is consumption. Advocates of expenditure taxes such as Meade argued that a direct expenditure tax could in this way be levied at progressive tax rates (at higher rates for those who consume more), and that if accompanied by a tax on inherited wealth they were as equitable (or more so) than personal income taxes.
So the key difference between an income and a consumption (or expenditure) tax is whether that part of income we save is taxed each year. An income tax does so, a consumption tax does not.
While people are accumulating wealth, a consumption or expenditure tax has the same effect as a tax on wages since it falls on labour income but not investment income. So to raise the same revenue without taxing investment income, it must be imposed at higher rates, and these would fall on wages. On the other hand, once people began drawing down their wealth to spend it (mainly after retirement) they would be taxed on the draw-down of their capital, much as superannuation benefits were taxed up until 2007. So increases in wealth would still be taxed, but later than under an income tax. An income tax taxes annual investment returns from wealth whereas a consumption tax ‘waits’ until wealth is spent.
Another important difference between personal income taxes levied directly on taxpayers and consumption taxes levied indirectly through producers and retailers (sales taxes such as the Goods and Services Tax) is that the personal income tax is levied at progressive rates (tax rates rise with income) whereas a sales tax is generally levied at a flat rate (10% in the case of the GST).
More detailed analysis of the impacts of income and consumption taxes on equity and economic growth is offered by Brooks, Auerbach, and Henry. Those wanting to keep up with current Australian tax debates should visit the Tax Watch site.
Who’s the fairest?
Whether a tax is equitable depends how we measure ‘ability to pay’. The equity case for income taxes rests on two pillars. First, that income or ‘spending power’ is a better measure of ‘ability to pay’ than expenditure because the ability to save and invest part of our income enlarges life choices (for example, to improve our housing security by buying a home). Second, that the ability to save is skewed in favour of the well-off and the tax-transfer should redistribute spending power to those with the least. The ‘ability to pay’ case could be described as the ‘soft argument’ for income taxes whereas the re-distributional case can be described as the ‘hard argument’.
Expenditure tax advocates put a contrary view: that spending is a better measure of well being and that by taxing the returns from saving, an income tax imposes a bias in favour of current spending and against future spending.

When we compare the impact of consumption taxes on households at different income levels, we find they are generally regressive (imposing higher tax rates on those with less income then those with more) when measured in proportion to household incomes, but close to proportional (a flat or uniform tax) when measured in proportion to spending.
The deferral of tax on savings under an expenditure tax benefits people who save the greatest part of their incomes. So whether an income or consumption tax is more equitable depends to a large extent on household saving patterns.

In any given year, high income earners in Australia save a great deal more than low income households. If we compare saving rates (saving as a proportion of household disposable income) among each 20% of Australian households ranked by income in 2010, we find that the top 20% saves on average about one third of its income
(the red bars in the graph) but the bottom 20% spends more than its income (by drawing down savings or borrowing). So their average saving rate is -20%. This means that in a given year, one third of the income of the top 20% would be exempted from a tax on consumption, while low income earners would be taxed (at the rate of the consumption tax) on more than 100% of their income.

Due to these household saving patterns and the progressive tax rates that apply to personal income (including a high tax free threshold), a recent ACOSS analysis using ABS data found that in 2010 Australian income taxes (blue bars) were progressive while consumption taxes (red and green bars) were regressive (i.e. tax rates fall with income). The bottom 20% of households paid 3% of their income in income taxes and 21% in consumption taxes, while for the top 20% the order is reversed (20% in income taxes and 8% in consumption taxes). Joe Hockey please note, these are average (overall) tax rates, not marginal tax rates.
From the standpoint of ‘ability to pay’ in a given year, an income tax takes better account of differences in spending power by taxing those with more capacity to save at higher rates than those who spend all (or more) of their income due to financial constraints (for example unemployment or marital separation). A key exception is households that have substantial wealth which they are drawing down mainly for consumption rather than investment, but those circumstances would be unusual today.
Advocates of expenditure taxation argue that the equity of taxes should be measured over a life-time, not a single year. If we accepted this argument, there are two key tests we can use to establish whether income or consumption taxes are fairer.
The first test is whether the annual saving pattern in the earlier graph is repeated across working life. If not, then taxing consumption instead of income would shift the incidence of tax across the life course (from youth to old age) but it would not necessarily advantage people who are better off throughout life.
If on the other hand, the ability to save is unevenly distributed among different groups in the community across life, replacing the income tax with a consumption tax would increase inequality of lifetime spending power. There are many possible reasons for this: inherited wealth, innate ability, and the other advantages that accrue to people who make the ‘right’ choice of parent including parental investment in education and being raised in a good suburb. If this is so, then exempting investment income from tax is likely to enlarge the life choices of those who are already ahead of the game.
We can shed light on this issue by establishing whether people with higher incomes across working life save a greater share of their income. Dynan and colleagues researched this question in the US and their answer to the question Do the rich save more? throughout working life was ‘yes’. They found that the median saving rate among people in the lowest 20% of overall working-age incomes was less than 1% compared with 11% for the top 20%.
What does this mean for tax policy? If people with higher incomes across their working lives save more, then the income tax is likely to be progressive across working life as well as in a single year. There’s evidence to support this view from the UK.
 Brewer posed the question: How does the tax system redistribute income? He found that the UK income tax was almost as progressive when women’s incomes were measured across working life as it was on an annual basis. The exception was a much larger ‘negative’ annual income tax rate for the bottom 20% (the blue bar on the left of the graph). This was due to the the system of tax credits for low paid workers which partly replaced family allowances in the UK at that time.
A second test of the equity of a tax across the life cycle is whether it imposes higher tax rates on people at those stages of life when people can best afford to pay (for example just before they have children and just after they leave home) and lower tax rates at stages when their finances are tight (for example when raising children and after retirement).
This is what the income tax system (together with social security and family payments) does. They play an insurance role – shifting resources from times when people’s ability to save is strongest to times when they are more likely to struggle financially.

Income taxes are lowest when people are young or old, highest in between, and slightly lower in the early child raising years. Consumption taxes are less sensitive to changes in the ‘ability to pay’ across the life cycle – though this is really another way of saying that they are more likely to be regressive in a given year (as discussed previously).
This discussion suggests two conclusions. First, that deciding whether taxes are equitable involves much more than a simple comparison of tax rates. Second, that despite the complexity of these issues the common sense view that income taxes are more progressive than consumption taxes is probably right.
There is another equity argument raised in favour of consumption taxes: that they are harder for high income-earners to avoid. Few tax experts support this view. As Warren and Auerbach point out, if economic activity is ‘off the radar’ of the income tax, it’s probably off the radar of consumption taxes also. Greece relies more on consumption taxes than most OECD countries, but from all accounts the Government there still has a big problem with tax avoidance. The argument that well-off people can take advantage of income tax shelters is an argument for closing tax shelters.
Which is more efficient?
Since the 1980s, when Governments struggled with low levels of economic growth, high inflation and high unemployment, the debate over the ideal mix of tax between income and consumption has shifted from equity concerns to the impact of tax on the efficiency of the economy. Taxes almost invariably have an economic cost, though of course this should be weighed up against the economic and social benefits the programs they finance.
The economic costs of taxation can be reduced by taxing investment incomes consistently (and not so much that mobile capital decides to invest elsewhere), and avoiding high tax rates on those whose workforce participation decisions are strongly affected by tax (it turns out this is mainly mothers on low incomes).
As the ‘Henry Report’ found, most studies of the economic costs of different taxes conclude that taxes on land, resources such as minerals, and inheritances have the least adverse effects on the economy, that consumption taxes are less economically ‘efficient’ than these taxes but more so than income taxes, and that taxes on business inputs and transactions such as Stamp Duties are the least efficient. They generally also conclude that taxes which are broadly based (raised in a consistent way on different items or economic activities) are more efficient than narrowly based taxes (State Payroll Taxes, which exempt the majority of businesses, are an example of a narrowly based tax).
But be wary of simple ‘league tables’ of the efficiency of taxes. The impact of a tax on the economy depends on many factors including how broadly based it is, how high are the tax rates, a country’s economic structure, levels of inflation and interest rates, and whether the tax clearly falls into one of the above idealised categories. For example, the treatment of investment income under the Australian personal income tax is actually a hybrid of income and consumption tax treatment. I’ll return to these issues in Part 3 of ‘A brief history of tax’.
In theory, moving from taxing income to consumption should encourage saving and investment but discourage workforce participation. The logic here is that the cost of an income tax is shared between wage earners and investors whereas a consumption tax that raises the same revenue would fall more heavily on wage earners. The claim that shifting from income taxes to consumption taxes would improve paid work incentives doesn’t withstand close scrutiny. A reduction in income tax rates would, all things being equal, boost workforce participation. But if this is paid for by higher taxes on spending, consumer prices would rise and the spending power of wages would either remain the same or fall.
When Randolph and Rogers evaluated the economic effects of proposals to replace the US federal income tax with an expenditure tax in 1995, they concluded that the proposed reforms would probably boost long-run economic growth but there was a great deal of uncertainty about the extent of any improvement, and a significant chance that they would reduce growth. A key reason for this ambiguity was the offsetting impacts of higher saving and investment and lower workforce participation.
In theory, a switch from taxing income towards taxing consumption should boost household saving because the portion of income that is saved would be exempted from tax. Academic studies over the past two decades have examined whether expenditure tax treatment of saving (either by allowing deductions for contributions to savings accounts or exempting investment income from tax) increases household saving. Engen, Gale and Scholz found that tax breaks for saving influenced the choice of savings vehicle (e.g. towards superannuation and away from interest bearing deposits) but were unlikely to strengthen household saving overall. The OECD found that tax breaks for saving by high income earners were generally ineffective because they were likely to save anyway in the absence of incentives.
Unlike most research on the economic impact of taxes, the work of Apps and Rees took account of the unpaid labour of women, including its significance as an alternative to paid work. One implication is that women, especially mothers whose potential wages are modest, are relatively sensitive to the impact of taxes on the spending power of their wages. They found that a shift from taxing income to consumption was likely to reduce their workforce participation, and that this would reduce household saving since single-income families were less likely to save than two-income families.
The strongest potential economic efficiency gains from taxing consumption rather than income come from two sources. The first is the impact of the removal of income taxes on levels of investment, especially across international borders. Investment is more ‘mobile’ than labour. For example, people can more readily move their savings out of Australia than pull up stumps and work overseas. This implies that taxes on investment income should ideally be lower that taxes on wages since investment is more responsive to tax levels. The risks to public revenue and economic growth from increasing mobility of capital (due to internationalisation and new technology) were emphasised by the Henry Report. Recently, Operation Wickenby has shone a spotlight on the use of tax havens by high income earners to shelter personal investment income and assets.
The second potential efficiency improvement from taxing consumption rather than income comes from an unexpected source: an increase in the taxation of the wealth of retirees as it is drawn down and spent. An income tax does not tax savings unless they are invested and yield income. A consumption tax taxes the draw-down of savings, which mostly happens after retirement. For example, a sales tax reduces the spending power of retirement savings. A shift from taxing income to consumption thus leads to a one-off devaluation of retirement savings. This is unlikely to affect saving decisions and future economic growth because it is largely unanticipated and retirement savings are the product of decisions made throughout working life. To the extent that this windfall public revenue gain is used to reduce other taxes that distort economic decisions, it is likely to improve economic efficiency.
Yet a sudden loss of spending power is unlikely to be popular among retirees and Governments will understandably face pressure to compensate them.
The impact of compensation for low income earners and retirees adds to the uncertainty surrounding the impact of a shift towards taxing consumption on economic growth. Altig and colleagues found that compensation, especially of retirees for the reduced value of the savings, substantially reduces any improvement in long run economic growth from taxing consumption more and income less. More broadly, the larger the ‘compensation package’ for higher consumption taxes, the weaker the long term improvement in growth.
An OECD study undertaken in 2008 of the effects of different taxes on economic growth is often cited by Australian advocates of taxing consumption more and income less. This study attempts to isolate the impact of taxes on long run economic growth rates in OECD countries from other factors likely to have an impact. It ranks different taxes according to their estimated long run effects on growth. The rankings are the same as that used in the Henry Report (as listed above). It finds that, on average, consumption taxes are more pro-growth than income taxes, and property taxes (such as Land Taxes), are more pro-growth than either income or consumption taxes, but that the extent of the difference in their economic impacts is difficult to quantify. It is worth quoting the conclusion in full:
‘Estimates of the effect on GDP per capita of changing the tax mix while keeping the overall tax-to-GDP ratio constant indicate that a shift of 1% of tax revenues from income taxes to consumption and property taxes would increase GDP per capita by between a quarter of a percentage point and one percentage point in the long run depending on the empirical specification.The magnitude of the estimated effect is larger than what would be reasonably expected. Given that there is a wide dispersion of the point estimates across specifications it is clear that the size of the effects cannot be measured precisely in a cross-country comparative setting. …Thus, the magnitude of the effects should be interpreted with caution.’ (p43)
This underscores the difficulty in separating the ‘pure’ impact of a change in the tax mix from all of the other factors that contribute to economic growth levels.
Conclusion
The research on the effects of replacing income taxes with taxes on consumption can be summarised as follows:
The impact of a shift from taxing income to consumption on the distribution of income (at least in a single year) can be measured reasonably accurately and is regressive. This is due to differences in household saving patterns. The impact on economic growth in the long run is likely to be positive, but hard to quantify. Positive impacts on growth are mainly due to the effects of income taxes on investment levels (especially foreign investment) together with a windfall public revenue gain from taxing spending by retirees.
‘The tax code, once you get to know it, embodies all of the essence of life: greed, politics, power, goodness, charity. Everything’s in there.’ Sheldon Cohen, Former Commissioner of the US Internal Revenue Service.
Tax reform is back on the agenda. Since those who fail to study history risk repeating it (and I was involved in the latter-day history of tax reform) I’m writing this 3 part series as a guide for those involved in the next phase. Parts 1 and 2 dealt with the dominance of income tax since WW2 and the challenge from consumption taxes since the 1970s. This part: the ‘Trojan Horse’ discusses new thinking about taxes and their impact on the economy. It argues that our income tax already incorporates elements of a tax on consumption, that we should move beyond a simple dichotomy (and old arguments) between taxing income or consumption, and explore fresh ideas for reform.
A brief history of tax (Part 4):
The Trojan Horse (inside our income tax system)
Readers with an interest in the details can check out the references in Parts 1 and 2 of this series. Brooks provides a more detailed presentation of the issues raised in these three blogs. In addition, good summaries of some of the latest ideas in tax reform are provided by Auerbach, Evans, the Henry Report, and Henry. Those wanting to keep up with current Australian tax debates should visit the Tax Watch site.
A recap on the tax wars: income Vs consumption
To recap parts 1 and 2 of this series, the income tax became the main tax in Australia and most wealthy countries after WW2. After the 1970s, as policy makers worried less about income inequality and tax fairness and more about the state of the economy, there was a push to replace income taxes with taxes on consumption. The basic difference between income and consumption taxes is the treatment of investment income. Broadly speaking, this is taxed under an income tax but not under a consumption tax. Income tax advocates argued that investment income should be taxed because this, along with wages, was the best measure of ‘ability to pay’. Consumption (or expenditure) tax advocates argued that consumption was the better measure of people’s resources and that taxing investment returns discouraged saving and investment.
The income tax system continued to dominate the tax landscape, while for 30 years the battle of ideas raged outside. Its ideological champion was the comprehensive income tax: the idea that income from all sources – wages and investments – should be taxed at uniform (progressive) rates. It’s war cry was ‘a buck is a buck’. Advocates argued that the comprehensive income tax was not only fair – because spending power from different sources would be taxed equally. Uniform income taxation was also economically efficient because decisions to work, save and invest would be less influenced by taxes (e.g. people would pay the same taxes whether they invested in property, shares or an active business).
The champions of expenditure taxation took up the fight – in Australia it was the GST, in the US and UK cash-flow or personal expenditure taxes (different warriors, same suit of armour). Their war cry was ‘save and invest!‘ In the 1970s, the Meade Report in the UK and the Treasury in the US argued that by taxing investment returns, income taxes discouraged saving and diminished investment, holding back economic growth. They also challenged the fairness of income taxes, arguing that they were biased in favour of current spending and against saving to shift spending into the future. Their answer was to tax consumption or expenditure instead of income.
A fatal blow to the comprehensive income tax
The fatal blow to the idea of a comprehensive income tax came when the economic efficiency benefits of taxing income uniformly were seriously challenged by ‘optimal taxation’ research in the 1980s and 90s.
Actually, the idea that different activities should be taxed uniformly was challenged as early as 1927 when Ramsey argued that because taxes on different goods have different impacts on people’s spending habits, ‘optimal’ tax rates would vary from one good to the next. If people were less likely to stop buying food in response to a consumption tax than (say) go to the movies, then food should be taxed at a higher rate than the movies. The more responsive an economic decision was to taxation, the lower the tax rate should be, and vice versa. Ramsey was talking here about consumption taxes, but the idea was applied to income taxes as well.
Ramsey’s ‘optimal tax’ theories had little impact on public policy for many years. This was due to concerns about the equity impacts of higher taxes on essentials, uncertainty about the impact of taxes on different activities, and the complexity of a system that would impose different tax rates on different goods, services and incomes. There was also a risk that if tax rates on different activities were ‘up for grabs’, interest groups would lobby all the more vigorously for their own activity to be taxed less (i.e. it would encourage rent-seeking). Nevertheless, a branch of economics called ‘optimal taxation’, inspired by Ramsey’s ideas, grew in influence from the 1970s. It spawned fresh research on the impact of taxes on economic activity.

These studies generally found that taxing all income (wages and investment) uniformly (at flat or progressive rates) was not as efficient as comprehensive income tax advocates made out. They concluded that investment income should be taxed at lower rates than wages. This meant that a comprehensive income tax that was levied at uniform rates could only be defended on equity grounds. At a time when Governments worried more about declining economic growth than growing income inequality, this was a fatal blow to the ideal of a comprehensive income tax, despite the fact that reforms during the 1980s in the US and Australia moved us closer to it.
The problem was not that income taxes diminished saving. The evidence from optimal taxation research suggested that lower taxes on saving impacted people’s choice of savings vehicles (e.g. bank accounts Vs superannuation), but not the overall level of household saving. Further, in an open economy investment could be partly financed from foreign savings.
The problem was that income taxes were likely to discourage investment, especially across national borders. By the end of the last century, the consensus among economists was that more ‘mobile’ economic factors were more sensitive to taxation, and could pass the cost onto less ‘mobile’ factors. Being relatively mobile, capital was more likely than labour to shift to investments (or nations) with the lowest tax rates. Under these conditions, the cost of the company income tax was more likely to be passed on to workers. At the other end of the spectrum, land and mineral resources were said to be immobile. Taxes on these factors were more likely to ‘stick’, and less likely to affect investment decisions.
By the 1990s, the debate among most economists and tax experts was no longer whether all income should be taxed uniformly. It was about whether investment income should be taxed at all, or at a lower rate than wages.
The fatal weakness of expenditure taxes
Despite the defeat of the comprehensive income tax in the battle of ideas, as Part 2 showed the income tax system remained the dominant source of public revenue.

The idea that income taxes should be replaced by a tax on expenditure (viewed as the polar opposite of the comprehensive income tax) had its own fatal weakness. The public still equated ‘ability to pay’ with annual income, and it was clear that those with the lowest annual incomes would be adversely affected by higher taxes on consumption. For the most part (e.g. in the US, Canada and Japan, with New Zealand as an exceptional case), this equity argument proved fatal to any push to dramatically increase reliance on consumption taxes, or to Governments that successfully did so. As outlined in Part 2, despite three attempts in Australia to shift taxation from income to consumption, the tax mix between them remains much as it was before the GST was introduced.
Outside the United States (which relies less on consumption taxes than almost all other OECD countries), the idea that income taxes should be completely replaced by taxes on consumption has lost favour. Optimal taxation research has also begun to question the notion that this is a sure path to improved economic efficiency and growth.
Forty years after the UK Institute for Fiscal Studies’ Meade Report advocated replacing income taxes with a progressive expenditure tax, the same organisation reviewed the arguments for taxing income and consumption. The Mirrlees Review still favoured expenditure taxes over income tax, but it drew a distinction between different kinds of income – the ‘normal rate of return’ and ‘economic rents’ (see discussion below) – and only proposed to exempt the former from taxation. The Institute commissioned Banks and Diamond to evaluate the arguments for and against taxing investment income. Contrary to the overall thrust of the review’s proposals, they found that the case for complete removal of taxes on investment income was weak. Research studies supporting this view used over-simplified assumptions (for example that capital is perfectly mobile). They concluded that while the case for taxing investment income at the same rates as wages was weak, it should still be taxed.
Back in Australia, a similar critique was made by Apps of a report by KPMG for the ‘Henry Review’ which estimated the economic cost of different taxes. She argued that the model used in this report overestimated the impact of the Australian income tax on the supply of labour (compared with that of taxes on consumption) because it assumed that all households had a single wage earner who increased his working hours in direct proportion to increases in his after-tax wage. The fact that women on lower incomes were more responsive to the costs of paid employment than men on higher incomes did not feature in the model. Yet they would be more adversely affected by a shift towards taxing consumption.
Similarly, some economic models assume that capital is perfectly mobile. This leads to the conclusion that a small open economy cannot sustain a tax on company income. Yet if this key assumption is relaxed, the results look different. In his summary of this research, Auerbach refers to:
‘possible outcomes ranging from capital still bearing a large share of the [company income] tax (Gravelle & Smetters 2001) to most of the tax being shifted to labour (Harberger 2008).’
As the 12th largest, Australia’s economy is hardly ‘small’. Our economy has always relied on foreign investment, but it also relies on domestic savings. Around two thirds of equity in Australian companies is owned by local investors. Company income tax revenue has taken a hit recently with the fading of the resources boom, but it remains higher (in proportion to GDP) than its average level in the 1980s and 1990s.
The challenge for income tax advocates is that the growing reach of multinational corporations and capital markets, and innovations in financial markets and information technology, are easing constraints on the mobility of capital and making it harder to follow the money trail. International capital is moving into black holes and ‘bermuda triangles’ where no national tax administration can reach it. This suggests it will become harder to tax investment incomes, especially those accruing to foreign investors. A key part of the solution is to strengthen international cooperation on tax and close off the worst abuses, but this won’t fully solve the underlying problem.
The trojan horse inside our income tax system

While the battle of ideas raged outside, the income tax appeared to be safe inside its citidel. Yet its rival, the expenditure tax, was already concealed within. Recall that the main difference between income and expenditure taxes is the treatment of investment. The tax treatment of many investments is closer to expenditure tax principles: there is either a deduction for new investment, or investment income is fully or partly exempted from tax. The table below ranks the main investment assets in Australia and compares their tax treatment.
Tax treatment of major investment vehicles (2010)
| Asset type | % of of all household assets | Tax treatment |
| Own home |
43% |
Taxed on purchase, capital gains and imputed rents exempt (expenditure tax) |
| Superannuation |
15% |
Contributions & fund earnings partly taxed with deductions for new contributions, benefits exempt (hybrid tax) |
| Investment property |
15% |
Rent fully taxed, capital gains partly taxed (hybrid tax) |
| Other financial assets (e.g. shares and bank deposits) |
7% |
Bank interest fully taxed (income tax);Share dividends fully taxed & capital gains partly taxed (hybrid tax) |
| Own business |
5% |
Profits fully taxed, capital gains on business assets partly taxed (hybrid) |
We can see from this that investment income derived from over 40% of household wealth (capital gains and imputed rents from owner-occupied homes) is untaxed while income from at least another 40% is only partly taxed (mainly because capital gains are taxed a half the standard rate and only when the asset is sold – if at all).
Slemrod estimated that the effective tax rate on all investment income in the US was just 14-24% in 2002.
‘Calling a tax system an income tax or a consumption tax does not make it so. This is certainly true of the U.S. income tax system, which has long been recognised as a hybrid of an income and consumption tax, with elements that do not fit naturally into either pure system.’ Gordon et al, 2003
All income is not equal
Even the difference between ‘pure’ versions of income and expenditure taxes is not as stark as once believed. If we break investment income down into four component parts, it turns out that two of the four are taxed the same under income and expenditure taxes. The key difference is that only an income tax taxes the ‘normal’ or ‘risk free’ rate of return on investments, which is roughly equivalent to the Government bond rate.
Tax treatment of different components of income
| Investment income component | Income tax treatment | Expenditure tax treatment |
| Inflation component | Not taxed | Not taxed |
| Risk free or ‘normal’ returns | Taxed | Not taxed |
| Above-normal returns from risk | Not taxed | Not taxed |
| Above-normal returns from economic rents | Taxed | Partly taxed |
Part of the value of annual income flows from an investment such as a bank account is offset by inflation in the price of goods and services. Since this does not represent a gain in spending power, a ‘pure’ income tax should adjust investment income downwards for the effects of inflation. This was advocated by the Mathews report in Australia in the 1970s and implemented in our first tax on capital gains in 1985 (though not for other forms of investment income). So this ‘inflation’ component of investment income is not taxed under either a pure income or expenditure tax.
A second component of income is the ‘risk free’ or ‘normal’ rate of return which is also called the ‘reward for waiting’. Borrowers must usually offer a rate of return above inflation to attract investment; otherwise there would be little incentive for people to defer consumption. The minimum rate required is the ‘risk free’ rate, which applies to ‘safe’ investments such as Government bonds. This component of investment income is taxed by an income tax but not by an expenditure tax.
The third component is the extra (‘above normal’) return from risk. Riskier investments are more likely to make losses which attract income tax deductions (a pure income tax allows unlimited deductions for losses). This means that the extra or ‘above normal’ returns from risky investments are not in effect taxed under a pure income tax (and nor are they by an expenditure tax).
The fourth component of investment income is above-normal returns from economic rents. These arise where a business occupies a monopoly position in a market (as many believe the ‘big four’ banks occupy in Australia) or through scarcity in the supply of ‘immobile’ factors such as land or mineral resources. Where economic rents exist, returns are higher regardless of risk. Taxes on locally-specific economic rents, such as those arising from the exploitation of scarce mineral resources, are not a drag on economic growth because they remain an attractive investment proposition despite a tax on above-normal profits.
The economic rent component of profits is taxed under an income tax, but it may also be taxed under an expenditure tax. This is because even if new investment is fully deducted from tax (as it is with expenditure tax treatment) this concession is less valuable than the ‘super profits’ that can be obtained from economic rents. An important exception is the taxation of economic rents that accrue to foreign investors. In the absence of a domestic tax on company profits or on specific economic rents (such as those relating to mineral resources), these rents might escape tax in the source country (the country where the profits are made).
Of course, key elements of our income tax are either more or less generous than the ‘pure’ version. But these distinctions between different kinds of income are still important for tax policy. There is a strong case for taxing income derived from economic rents, whether directly or through company income taxes. On the other hand there is a strong case for taxing investments generally at lower rates than wages to take account of the impact of inflation on investment returns.
New ideas in tax reform
These more nuanced views of income and how it is taxed point to the real battle being fought within the income tax itself, over such issues as deductions for investment expenses, the treatment of capital gains, and tax breaks for long term saving. The set piece duels between the ideal of comprehensive income taxation and its expenditure tax rival have burnt up a great deal of political capital with limited effect, and may have distracted us from the main game.
These new (and not so new) understandings of taxation suggest that advocates of a progressive tax system should turn their attention to reforms of the income tax which:
- tax investment income more consistently, but at lower rates than wages (especially for long-term savings and foreign investment);
- target economic rents;
- take account of the impacts of tax on workforce participation by different groups, (especially low-paid women).
Another key problem to be solved (worthy of a separate blog) is the way the income tax interacts with the social security system. Income tests, together with the income tax, impose higher effective tax rates on low income earners. This problem can only be avoided entirely if social security payments are paid to everyone (as ‘demogrants’), and gradually clawed back above a high tax free threshold (e.g. through the tax system). In a revenue neutral reform, this would greatly increase tax rates on middle income earners (since the cost of semi-universal social security payments is too great to be borne by high income earners alone). In Australia these problems are sensibly addressed, but not solved, by income-testing income support payments for adults relatively strictly, and payments for children less so.
I’ll conclude with comments on some of the best reform ideas informed by this new thinking, including income taxes targeting economic rents, north European dual income tax models, wealth taxes, and the Henry Review proposals which draw upon all of these.
(1) Taxing economic rents
The basic approach to taxing economic rents is to tax profits minus an allowance for the risk free or ‘normal’ component of investment returns, on the assumption that the difference consists mainly of the proceeds of economic rents. This ‘residual’ profit is then taxed at a higher rate. This tax on ‘super-profits’ could be applied in conjunction with a standard company income tax (usually in industries where rents are likely to comprise the majority of investment income), or it could replace the corporate income tax altogether. In the latter case, the company income tax would be replaced, in effect, with a tax on corporate expenditure (this is proposed by the Mirrlees Review). The idea is to shift taxation away from investments that might be discouraged by tax towards those which are more likely to be indifferent to it.
A good example of an industry specific tax on rents is a mineral resource rent tax. To the extent that mineral resources are scarce and geographically immobile, they are likely to yield ‘above normal’ profits and taxing them in the source country is unlikely to discourage investment. The original idea for a resource rent tax came from Brown in the 1940s. Under his formula, expenses associated with exploration and extraction would be fully and immediately deductible and profits taxed well above the standard company income tax rate. In effect, the Government, as the owner of mineral resources, would join the investor as a silent partner, sharing the risk should a project fail and the returns if it succeeds. Ideally, this would replace royalties for the extraction of mineral wealth (based on the quantity extracted), which are more likely to discourage marginal investments and yield less revenue for Governments in the long run.
One problem with this ‘pure’ Brown tax is the long delay in collecting public revenue from mining projects (and the attendant tax avoidance opportunities). Indeed, there may be an initial revenue loss from the up-front deductions for exploration and other costs. To deal with this problem, mineral resources taxes such as the Norwegian one, and the Resource Rent Tax proposed in the Henry Report, required miners to carry forward these expenses and offset them against future income. If the project made a loss, any remaining expenses would be refunded. In return for the deferral of deductions for investment, these resource rent taxes only taxed profits above the ‘normal’ rate of return (often proxied by the public bond rate). One problem with this approach is that tax revenues would take a hit from loss-making projects in the aftermath of economic downturns – without any clear benefit to the ‘real’ economy. Nevertheless, a well designed resource rent tax is likely to raise more revenue than royalty payments, with less distortion of investment. Australia still has a Petroleum Resource Rent Tax on offshore oil mines.
In theory a similar result could be obtained across all sectors of the economy by deducting ‘normal’ returns from company income before taxing it, and taxing the remaining profits at a higher rate. In one prominent corporate income tax reform proposal, this ‘deduction’ is called an Allowance for Corporate Equity (ACE). The basic idea is that a company’s income tax is reduced by a percentage of shareholder equity in the company equivalent to the normal rate of return. Companies with low profits relative to investment assets would gain at the expense of those with higher profits (at least some of which are assumed to come from economic rents).
The case for taxing economic rents seems to be straightforward – public revenue is collected with less disruption of investment than from traditional company income taxes or mining royalties. If, however, taxation of economic rents replaced company income tax this would narrow the tax base since the normal rate of return would be exempt from tax. Taxing economic rents alone is equivalent, in principle, to replacing the personal income tax with a tax on expenditure (as discussed previously).
This raises some difficult questions: Would such a system raise the same public revenue without a much higher tax rate? Or would it reduce taxes on corporate income and make it harder to tax personal income, given the cross overs between the two sectors? Could a single country introduce such system and what would be the transition costs? The Henry Report raised the ACE as an option for the future but did not advocate it, opting instead for an industry-specific approach in the form of a minerals resources rent tax.
In the meantime, our company income tax captured – however imperfectly – a share of the income from economic rents during the mining boom at little cost to economic growth – but that revenue bonanza wasn’t going to last forever.
(2) Dual income taxes
While the Anglophone countries debated taxing investment income less, the high-taxing northern Europeans – under pressure from the easing of restrictions on capital movements across Europe – went ahead and did it.
From the 1990s on, the Scandinavian countries and Holland have formalised a previously implied distinction in their tax systems between income taxes on wages and investments. The logic of these dual income tax systems was that wages would continue to be taxed at progressive rates but investment income would be taxed at a lower rate, identical to the company income tax rate. This was a compromise between comprehensive income taxation and an expenditure tax (under which the tax rate for investment income is set at zero).
As described in an ACOSS Paper on personal income tax, the income tax system would be split into two parts: wages and investment income.
Dual income tax systems in Nordic countries (2004)
| Norway | Finland | Sweden | Denmark | |
| Tax rate for earnings | 28-48% | 29-52% | 32-57% | 38-59% |
| Tax rate for investments | 28% | 29% | 30% | 28/43% |
| Company tax rate | 28% | 29% | 28% | 30% |
| Offset of investment losses | Within 1st tax bracket only | Tax credit | Tax credit | Within 1st and 2nd brackets only |
| Net wealth tax | 0.9-1.1% | 0.9% | 1.5% | None |
An important feature of dual income tax systems is that deductions against one form of income (e.g. investments) against the other (e.g. wages) are restricted. This had a surprising impact on public revenues when Sweden established a dual income tax system in the midst of a deep recession in 1991. Despite the lowering of tax rates for much investment income, revenues rose substantially. More revenue was gained from denying deductions to home owners and property investors than was lost from the lower tax rates on investments.
An important benefit of the dual income tax is that it gives policy makers the flexibility to respond to downward pressures on tax rates on investment without undermining the progressivity of the tax on wages. This is balanced by some desirable elements of rigidity: tax rates applied to most investments are more consistent and the investment income tax rate is ‘anchored’ at the first step in the tax scale for wages (see table above). This is important for both equity and acceptability reasons. It means that high-income investors do not pay tax at rates that are lower than typical workers.
Dual income taxes have been criticised on equity grounds for not taxing all forms of income consistently. As shown above, the reality is that effective tax rates for most investments in Australia are already well below the standard marginal rates (especially for owner occupied homes and capital gains on other investments). If we abandoned the quest for a uniform comprehensive income tax and introduced a dual income tax, it would in a sense formalise the status quo, except that that investment income taxes would be more consistent and less distorting. To the extent that this results in higher tax rates on capital gains it would improve equity as these are heavily concentrated among the top 10% of income earners in most countries. Another bonus is that ‘negative gearing’ strategies would no longer be viable.
One problem from an equity standpoint is that low-income investors would pay tax at the same rate as high income earners. In the absence of a tax free threshold on investment income, this would bring many retired people on modest incomes into the tax net for the first time.
The main practical weakness of dual income tax system is the difficulty in drawing clear distinctions between labour and investment income, especially when labour is supplied through a private company. Scandinavian countries deal with this problem by taxing an implied return from small business assets at the (lower) investment income tax rate, and any remaining income at the (higher) tax rates for wages.
(3) Taxes on wealth
The defining feature of income taxation is that it taxes the accumulation of wealth (whereas consumption taxes tax the dissipation of wealth). An indirect way to achieve the same end is to tax the stock of wealth itself.
Since wealth is much more unequally distributed than income (the top 10% of Australian households by wealth holds roughly half of all wealth while the top 10% by income have roughly a quarter of all income), an effective wealth tax is likely to have a stronger inequality-reducing impact.

In Australia over the last 30 years, the top 10% of income-earners received around half of all increases in private income while the top 1% gained more than 20%. Taxes on wealth are another policy tool to offset this trend.
Annual wealth taxes – at low rates above a high tax-free threshold, and with owner occupied housing exempted – exist in three OECD countries. Their main weakness (as with taxes on investment income) is that to the extent that they tax mobile factors the revenue base could slip away. Broad-based wealth taxes in most countries that previously used them were easily avoided, and collected little revenue at relatively high cost (including annual valuation of assets).
Recognising the ‘mobility’ problem, Picketty advocates a modest broad-based international tax on wealth holdings, at progressive rates above a high threshold. His motive is to avoid the entrenchment and growth of wealth and income inequality, especially at the very top (1%) of the distribution. A wealth tax is easier said than done in a global context, but it could be an future option for international federations, especially Europe.
The ‘mobile wealth’ problem does not arise with immobile factors such as land. A well designed land tax is not only hard to avoid, it encourages the efficient use of land. Since it is tied to a specific location, land tax is an ideal tax base for Local or State Governments. Replacing taxes on housing transactions such as Stamp Duties with a modest land tax with minimal exemptions would improve the efficiency of property markets.
The tax base for taxes on estates or inheritance is transfers of wealth rather than the overall stock of wealth held by an individual. Unusually, these taxes attract ‘bipartisan’ support from income and consumption tax advocates. Inheritances would be captured under a comprehensive income tax. Consistent advocates of expenditure taxation argue that estates or inheritances should be taxed, on equity grounds, if income taxes were replaced by an expenditure tax. They are among the most equitable and economically efficient taxes. A tax on a windfall gain (or an estate whose final value is not known in advance) is unlikely to distort investment decisions, and it should encourage workforce participation to the extent that the beneficiaries are close to retirement and the windfall allows them to retire earlier. Around two thirds of OECD countries have estate or inheritance taxes. Australia did until the 1970s when they were wiped out by interstate tax competition.
Apart from their unpopularity, the main challenge for a tax on wealth transfers is stemming avoidance through such devices as gifts and private trusts, so that they fall on people with substantial wealth rather than those lacking the wherewithal to avoid them.
An interesting variation on wealth taxation is the use of wealth as a proxy for income. The Netherlands replaced its income tax on interest bearing accounts, shares and investment property with a tax on a (low) deemed rate of return on investment assets (owner occupied homes and small business assets were exempted). The idea was that it would be easier to measure (and capture) wealth than the income derived from it, and that such a tax would encourage its efficient use (since any income above the deemed rate of return is not taxed). Australian pensioners will recognise this idea – a ‘deemed rate of return’ on investments is used in the pension income test. Aside from its potential complexity, one disadvantage of this approach is that economic rents would not be taxed. Indeed, ‘deeming’ moves in the opposite direction to tax reforms which aim to tax rents but not normal rate of return.
(4) The Henry Report
I’ll end this series at the best place to begin a serious discussion of tax reform in Australia: the Henry Report. This major review of the Australian tax system undertaken by an expert panel chaired by the then Treasury Secretary, Ken Henry, sat somewhere in between the comprehensive, academic-led Mirrlees Review in the UK and the more short-term oriented, politically endorsed Taxation Working Group review in New Zealand.
The Henry Report pitched its reform proposals to the medium term (so I’ll ignore the short term responses of the major political parties – this is a longer game). It identified a number of challenges including revenue adequacy as the population ages, the internationalisation of economies spurred by technological innovation, distortions in the system that discourage investment or workforce participation and undermine housing affordability, and to strengthen equity in the income tax and transfer system.
Critics argue the Henry Report lacks a coherent reform narrative or framework, based on ‘ideals’ such as comprehensive income or expenditure taxation. Yet the outline of a framework is there, just below the surface. Its first recommendation is that:
‘Revenue raising should be concentrated on four robust and efficient broad-based taxes:
-
-
personal income, assessed on a more comprehensive base;
-
business income, designed to support economic growth;
-
economic rents from natural resources and land; and
-
private consumption.
-
We can see already that the Review Panel favoured an income tax that taxed different kinds of income more consistently, but mindful of the optimal taxation literature it did not advocate uniform taxation of investment and labour income. Its reform framework for income taxation is closer to the dual income tax model, or perhaps a ‘triple’ income tax comprising:
- Progressive taxation of wages;
- Taxation of income from shorter-term savings vehicles (including interest, dividends, and rent) at a 40% discount off marginal tax rates on wages;
- More concessional tax treatment for the two main longer-term savings vehicles (the current expenditure tax treatment for owner occupied housing, and a capped rebate for saving through superannuation).
The idea is to tax investment income at lower, progressive rates than wages (though less progressive than the present system due to a proposed flattening of the tax scale for wages, the economic benefits of which are not demonstrated). The proposed 40% discount is borrowed from the current tax treatment of personal capital gains, which attract a 50% discount off marginal personal tax rates. The 40% discount is a ‘rough and ready’ adjustment for the effects of inflation on investment income.
Under the proposed income tax system, taxes on capital gains would rise while taxes on interest and rents would fall, creating a more level playing field. While the proposed progressive tax rates for investment income are on the face of it more equitable than the flat-rate investment taxes in Northern Europe, there is no clear logic to the 40% discount. There is a risk that the discount would be ‘bargained upwards’ through the political process. In its response to the Report, the then Government proposed to increase the discount to 50%, albeit with a cap on the level of investment income to which it would apply. Alternatives to the proposed 40% discount include an explicit discount for inflation (one that varies with the inflation rate, which of course is now very low) or a variant of the northern European system with a tax free threshold for all investment income together with a flat tax rate ‘anchored’ in the marginal tax rate of a typical middle income wage-earner.
The exemption of owner occupied housing is politically and fiscally sensible. If Capital Gains Tax was extended to the main residence it would probably be limited to a small minority of home-owners, and home buyers should arguably be entitled to claim deductions for mortgage interest, at far greater cost to the fisc.
Special treatment for long term saving through superannuation is also desirable, since the impact of both inflation and income taxes on savings compounds over time. The review proposes fairer and more efficient tax breaks for saving through superannuation, including a capped rebate similar to proposals advanced for many years by ACOSS.
On the indirect tax side, the Report advocated the replacement of inefficient State taxes on business inputs and transactions (mainly Stamp Duties) and a broadening of the State Land Tax base to include owner occupied housing.
Its company and business income tax reforms focus on ‘supporting economic growth’. Here a trade-off is proposed between higher taxation of mining resource rents and the removal of some business tax concessions, and a lower company tax rate (from 30% to 25%), which is the ‘average rate for small to medium OECD economies ‘. The Review bought the argument that international capital is becoming more mobile and sensitive to tax, but wished to avoid a ‘race to the bottom in company income tax rates’ of the kind that created speculative investment booms in Ireland and Iceland. The quantity of investment matters, but so does its quality. Once again, this approach is more consistent with the Dual Income Tax model (with company income still subject to tax but at a lower rate) than the expenditure tax proposals of the Mirrlees Review. The transfer of resources from a booming mining sector to other industries (via a lower company tax rate) was also designed to aid Australia’s economic adjustment to the mining boom (since the high dollar was strangling other industries).
The Government’s ‘riding orders’ to the Panel to avoid discussion of the GST or taxation of superannuation benefit payments limited the scope of the Review. On the other hand, the state of media and public debate on taxation in Australia is such that if the Report had advocated a higher GST (or, for example, the introduction of an inheritance tax), none of the other recommendations would have been publicly discussed. The Review’s ‘core’ proposals as outlined above are arguably more important.
There were gestures in the direction of expenditure tax treatment of business income: the ACE was given a positive review (but not recommended for now) and there was a suggestion that State Payroll Taxes be replaced by a business cash-flow tax. Here the Review came perilously close to advocating an extension of broad based taxes on consumption, though the distributional impact of such a move is not clear since Payroll Tax already falls mainly on wages and consumer prices. As discussed in Part 2, replacing an inefficient tax on consumption with a more efficient one is not necessarily regressive.
As discussed above, the implications of such proposals for the future of personal income taxation are unclear. But rather than argue for ‘fundamental tax reform’ of the kind long advocated in the US (a major shift from taxing income to taxing expenditure) the Review Panel was content to wait for the dust to settle on the research evidence, and also the practicality, of such a move, noting that ‘a business level expenditure tax could suit Australia in the future.‘
The Henry Report, like the northern European Dual Income Tax model, is a working compromise between the old ideals of comprehensive taxation of income and expenditure, a bridge between the existing ‘mess’ (as Freebairn puts it) and a more coherent system. The proposals aren’t perfect, but that’s how tax reform works.
Concluding comment
Writing this three part ‘brief history of tax’ was a bit like walking through a hall of mirrors. The same passage looks different each time we walk through. In Part 1, the income tax was king and the main goal of reform was to tax income as uniformly and comprehensively as possible. Things looked different in Part 2 when viewed from the perspective of the ‘clash of the titans’ between two idealised tax systems: comprehensive income and expenditure. It turned out that the big difference between them is timing – whether we should tax returns from investment now or later. Still, this is an important distinction especially from an equity point of view, and that’s why consumption taxes (despite the vital contribution the make to efficient revenue raising) have not gained the upper hand.
In Part 3 we took a walk inside the income tax system while the champions slugged it out beyond the walls. The king is now not what he seemed to be. Our income tax system has expenditure taxes hidden within. It’s no longer obvious that the path to reform leads to either a pure comprehensive income tax or its replacement by a consumption tax.

The most important battles for reform lie within the income tax itself. Some are familiar, such as the unceasing effort to rid the system of unproductive tax shelters (Sisyphus comes to mind here). Others are new, including efforts to seek out and tax economic rents. I hope this series helps equip a few people to fight them.
New ACOSS report:’Paying our fair share’.
A new ACOSS report released this week looks at how overall rates of tax vary among households, according to income. It follows on the heels of a claim by the Treasurer, Joe Hockey, that middle income earners pay half their income in taxes. Borrowing from ‘tax freedom day’ campaigners, he claimed we work six months of every year for the Government (though they reckon it’s all been paid off by April).
This surprised pretty much everyone who knows the difference between marginal tax rates and average (overall) tax rates (the marginal tax rate is only paid on that part of your income above your highest tax threshold, not all of your income).
Using published ABS data, the ACOSS report shows that middle income households paid a total of 23% of their gross incomes in tax in 2010, comprising 11% income taxes and 12% taxes on consumption. About half of Hockey’s 50%.
But the real story of the ACOSS report is how the progressive effects of the income tax are almost offset by the regressive taxes on consumption.
Below are the average rates of income tax paid by each 20% of households in 2010. They rise with income. And underneath that, what we pay in consumption taxes. Those taxes reduce with income, because high income earners save about a quarter of their income (and don’t pay consumption taxes on that portion) while low income households spend about a quarter more than they earn (e.g. they are drawing down savings or going into debt to survive). Note the impact of all the hidden consumption taxes (excises on fuel, alcohol, etc, Payroll Taxes and Stamp Duties), which is greater than the GST.
 Putting the two together, the Australian tax system is close to ‘flat’. The bottom 20% pays an average of 24% while the top 20% pays 28%.
The more we increase consumption taxes and cut income taxes, the less progressive it gets.
