
Peter Davidson, presentation at ‘Employment Services for the Future conference’, Centre for Public Policy, University of (Melbourne, February 2013).
Two-thirds of recipients of Newstart Allowance have been unemployed for more than a year.Long term unemployment is associated with poverty, poor health, and higher levels of structural unemployment. As the population ages and gaps emerge in the paid workforce, Australia will have an opportunity to solve one of our worst social problems and meet one of our most pressing economic needs at the same time.
While sustained economic growth is essential to reduce long term unemployment, it is not sufficient. Evidence from Australian and international program evaluations suggest that employment services can improve the job prospects of people unemployed long-term.
Australia’s largest public employment program, Job Services Australia (JSA), is under review and a revised program is expected to be announced this year.
This paper attempts to answer the following three questions:
- What forms of employment assistance are most effective in reducing long term unemployment, based on recent international evidence?
‘Activation’ of unemployed people can reduce long term unemployment by requiring and assisting people with reasonable good job prospects to search for employment more effectively. Activation on its own is not sufficient. People who are unemployed long term or at risk of it usually face specific hurdles to employment such as low skills, a lack of work experience, or disabilities. Broadly speaking, paid work experience (using wage subsidies) in regular jobs and substantial vocational training (preferably linked to a job) are relatively effective in overcoming these barriers to employment while very short training courses (for example, less than three months) and ‘make work’ schemes, whether paid or unpaid (work for benefits) are relatively ineffective. That said, the international evidence suggests that successful interventions are generally those which are tailored to individual needs (of jobseekers and employers), rather than standardised.
- Are resources in the JSA system effectively targeted to assist long term unemployed people?
Australian and international evidence suggests that it is generally cost-effective to target the most intensive help towards people who are unemployed for one to three years, since fewer of this target group would find employment without assistance. The JSA system shifted resources from people unemployed long term towards those people unemployed for less than a year who were assessed as at-risk of long term unemployment. As a result, providers are typically funded to interview a person unemployed for one to two years every two months and purchase only $500 worth of work experience or training, on average. While not conclusive, the evidence suggests that this shift of resources reduced the effectiveness of the program in assisting those who were already unemployed long-term.
- Does the JSA system encourage efficient investment in work experience, training and other supports needed by long term unemployed people?
Overall Australian public investment in labour market assistance has been low – about half average OECD levels – since the Job Network was introduced in 1998. Within this pool of funds, Australia spends relatively more on job search assistance and less on work experience and training programs for unemployed people. While in theory outcomes-based funding of non-Government employment services should encourage cost-efficient investment in disadvantaged jobseekers, in practice it has rewarded providers who concentrate on low cost job search assistance rather than patient investment in work experience and training. Since the late 1990s, Governments have directly funded their preferred forms of work experience and training to fill some of the resulting gap in employment assistance.
In the Job Network period, a ‘work for benefits’ scheme (Work for the Dole) was favoured over vocational training, and this was reversed with the introduction of JSA. If funds invested in Work for the Dole (a relatively ineffective program) were replaced by substantial vocational training linked to employment opportunities, this would likely have improved the effectiveness of employment assistance. However, providers were only resourced to purchase relatively ineffective short courses and faced pressure to place people in readily-available State Government-funded courses to meet jobseeker activity requirements at low cost. Average employment consultant caseloads were over 100 which left little room for individualised assistance.
Under these conditions, the JSA program was likely to have a similar net employment impact to the Job Network, since the basic design of the two programs was otherwise similar. Average ‘gross’ employment outcomes following participation in JSA were at first similar to those of the Job Network, with just under 50% of participants in employment three months after leaving the program. Average employment outcomes fell after the GFC and declined further during 2012, but this is likely to be due to adverse labour market condition rather than changes in employment assistance.
The conference presentation concludes with a brief assessment of the Government’s restructure of Job Services Australia, which was not available at the time of writing.
The problem: growth in long term unemployment and its effects
There are many good reasons to reduce long term unemployment, including its health and social effects, and the link between long-term and structural unemployment[1].
An individual’s employment prospects decline sharply the longer they are out of work. This is due to long term unemployment itself and other factors such as poor health or low skills that predispose people to long term unemployment. Almost half (47%) of new recipients for Newstart Allowance (60%) leave that payment within the first 6 months. However, among those already on unemployment payments for 12 months, approximately half still receive those payments a year later[2]. Among unemployed people receiving Job Services Australia services(JSA) in 2012, 58% of those unemployed for one year, and 91% of those unemployed for two years, were in the JSA system a year later[3].
While the unemployment rate has fallen over the past two decades, a growing proportion of individuals reliant on unemployment payments are long-term recipients.
Figure 1 shows trends in unemployment over the last two decades, a period during which the unemployment rate fell from 11% in 1993 to 4% in 2007, and then rose again to 6% in 2013 following the international economic downturn (GFC) in 2008[4].
Figure 1: Unemployment rate, Australia

Source: ABS,Labour Force survey.
Figure 2 shows changes in the duration profile of spells on unemployment payments over the same period[5].In 2013, approximately two thirds (65%) of the 753,000 recipients of Australian unemployment payments (Newstart Allowance and Youth Allowance – Other) had received income support for at least one year. Half (49%) had received it for over two years[6].
Figure 2
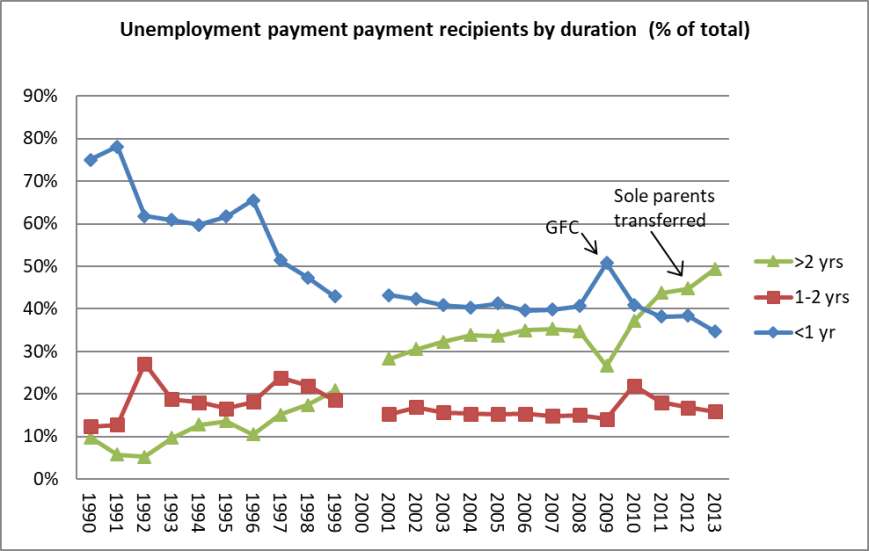
Source: Department of Social Services (2014); Department of Employment (2014d).
As unemployment fell between 1993 and 2007, the proportion of recipients out of work for less than one year declined in line with the fall in the unemployment rate (figure 1) as they picked up opportunities in an improving labour market. The proportion unemployed for one to two years remained fairly constant. However the proportion unemployed for over two years (‘very long term unemployed’) rose steadily, suggesting that this group was more disadvantaged in the labour market and benefited less from the more favourable labour market conditions. Following the Global Financial Crisis in 2008 more people entered unemployment and the proportion of recipients unemployed long-term declined. After 2009 this pattern was reversed as the inflow to unemployment payments subsided and a growing proportion of unemployed people received unemployment payments for two years or more. Their number was boosted from 2012 by successive Budget decisions to transfer sole parents on the Parenting Payment Single payment to the lower Newstart Allowance, since they generally rely on income support for longer periods of time[7].
What forms of employment assistance reduce long term unemployment?
To answer our first question, we need to measure the effectiveness of different forms of employment assistance. A key challenge for effectiveness evaluations is to distinguish between outcomes that would have been attained without assistance (the ‘deadweight cost’ of a program) and the difference it makes to employment and other outcomes (its ‘net impact’).
‘Net impact’ evaluations aim to measure the value added by employment programs by comparing outcomes achieved by a sample of program participants and those of a comparable control group. This can be done through experiments in which individuals are randomly assigned to control and treatment groups (rarely been used in Australia), by using regression techniques to ‘match’ program participants and non-participants according to observed characteristics such as age and qualifications (the method most commonly used), or using ‘natural experiments’ which take advantage of differences in the timing or targeting of programs when they are introduced or expanded (for example where a new program is restricted to people within a certain age group)[8].
No net impact study of the effects of the JSA system has yet been published, but we know about the effects of its predecessor program the Job Network on employment outcomes and exits from income support from a number of evaluation studies of that program, including net impact studies. Specific interventions such as work experience programs, training, and job search assistance have also been evaluated using these methods, both here and overseas. Relevant conclusions are summarised below.
On average, employment impacts are greater for long term unemployed people
Figure 3 compares the net impact (in percentage points) of the highest level of Job Network assistance, Customised Assistance, on the probability of exits from income support for clients with different unemployment durations, 12 months after commencing each‘stage’ of Job Network assistance[9].
Figure 3

Source: Department of Education, Employment and Workplace Relations(2010).
Note: Estimated impact of the program on exits from income support 12 months after commencement in the program. Estimates for those unemployed over 24 months are for the ‘second stage’ of Customised Assistance.
The estimated distribution of net impacts forms an inverted ‘U’ shape, with impacts rising with unemployment duration up to around two years, then falling. This is consistent with evaluation findings in a number of other OECD countries[10]. This suggests that it is cost efficient to target more expensive forms of employment assistance towards long term unemployed clients. The reason for this is that their employment prospects are lower without assistance and deadweight costs are minimised. It is noteworthy that those who received Customised Assistance before 12 months of unemployment were assessed as facing a high risk of long-term unemployment using a profiling tool. The relatively low average net impact for this group illustrates the limitations of profiling tools in predicting prolonged unemployment and targeting employment assistance. It is worthwhile to ‘intervene early’ where people are at risk of long term unemployment but deadweight costs are greater because we cannot predict with complete accuracy which individuals will become long-term unemployed without further help.
An average ‘net impact’ of up to a 10 percentage point increase in employment in the short to medium term is fairly typical of the results of these evaluation studies[11]. While these results are modest (and imply a deadweight cost of 90%), if they are sustained for a number of years across the population of long term unemployment benefit recipients then long term unemployment and reliance on income support would be greatly reduced[12].
Effects of activation and job search assistance
The average net impacts of a generic program such as Job Network mask a diversity of impacts from different interventions on different target groups. We need to shine a light into the ‘black box’ of employment assistance to understand which interventions make the most difference under what circumstances.
In assessing the impact of different of different interventions, it is useful to separate them into the combination of ‘activation’ (keeping people engaged with the labour market through activity requirements, penalties and regular interviews) and job search assistance (practical help with job search) which together form the generic core of most labour market assistance; and specific work experience and training programs for more disadvantaged jobseekers.
‘Activation’ has been found to significantly increase transitions to employment at relatively low cost, especially for less disadvantaged jobseekers and in the early stages of establishment of a rigorous activation regime[13]. This appears to be mainly due to its incentive or ‘threat’ effects: when they are interviewed or new activity requirements are imposed, many unemployed people intensify their job search andfind employment.Examples of significant employment effects from Australian activation policies include the introduction of ‘Newstart interviews’ for long term unemployed people introduced in 1990 which were estimated to increase exists from income support 6 months later by 8%, and the new activity requirements for sole parents with school age children introduced in 2006 which were estimated to increase exits from income support 12 months after a benefit claim by an average of 12%[14].
However, there is also evidence to suggest that returns to activation diminish when its intensity is increased in a mature system of activity requirements, interviews, and compulsory referral to employment programs. For example, when an additional ‘9 month intensive review’ interview was added to the schedule of regular meetings with Australian employment services in the late 1990s, the evaluation found that it had no measureable impact[15].
Further, the intensification of activity requirements and compliance monitoring appears to be less effective for the most disadvantaged jobseekers, presumably because (without additional help) their employment prospects remain limited even if they search more intensively. A ‘Job Seeker Diary’ introduced for unemployed people to record their job search efforts for Centrelink had much weaker employment impacts for long term than short term unemployed people[16]. The introduction of ‘review interviews’ for people unemployed for five years or more was also found to be ineffective.[17]
Effects of work experience and training
For people with significant barriers to employment (which includes most long term unemployed people), activation and job search assistance is more effective if backed up with work experience training and other programs that improve work capacity.This was the logic behind the successful New Deal for Young People (NDYP) in the United Kingdom, which offered a sequence of intensive job search assistance for up to three months followed by compulsory referral of those still unemployed to one of four ‘options’ – a temporary subsidised private sector job, education and training, voluntary work, or unpaid work on environmental projects[18]. When the corresponding ‘New Deal’ program for long-term unemployed adults (NDLTU) was first introduced in 1989 it offered activation and job search assistance but not the ‘options’. When it was found that the program was much less effective than the NDYP, at first job search requirements and contacts with advisers were increased. This made little difference to employment outcomes.When ‘options’ such as work experience and training were later added to the program, employment outcomes doubled[19].
Policy makers have sought to combine the best of both worlds – consistent activation and flexible investment in work capacity building – by incorporating individually tailored employment and training programs into regular spells of intensive activation. International examples include the New Deals in the United Kingdom and regular intensive activation of long term unemployed people in Denmark since the mid 1990s[20]. Critical to the effectiveness of these approaches is the intensity and quality of engagement between a jobseeker and their caseworker[21].
Net impact evaluations of work experience and training programs suggest that[22]:
- Temporary wage subsidies in private sector employment are relatively effective because employers often keep the jobseeker on after the subsidy expires, but positive impacts are likely to be partly due to selection effects (‘creaming’ through provider or employer selection of the ‘best candidates’)[23]
- Temporary employment in ‘additional jobs’ in the public sector (‘job creation’) is relatively ineffective due to ‘lock-in’ effects and the poor quality of the work experience usually provided, except for a minority of people with severe disadvantages and very limited recent work experience[24]
- Work for benefit schemes have substantial ‘referral’ or ‘compliance’ effects (since some people leave benefits when referred) but little impact on employment prospects among those who commence the program (since the work experience is usually far removed from paid employment in the open labour market and there is little upgrading of skills)[25]
- Vocational training is effective, especially for people with latent skills such as sole parents who left education early, but positive employment impacts can take years to occur, and as with the other programs above, ‘lock in effects’ (withdrawal from active job search during program participation) are significant during program participation. On the other hand, very short courses are ineffective. Training is generally more effective if linked to on the job work experience or preparation for a particular job[26].
Emerging approaches
In recent years, attention has turned to new interventions to assist long term unemployed people into employment.
One of these is called the ‘demand led’ or ‘employer partnerships’ approach in which employment service providers enter into a formal agreement with an employer to train and place disadvantaged jobseekers with them. The Australian Council of Social Service, together with the Business Council of Australia and Australian Council of Trade Unions last month released a statement calling for the broader adoption of these approaches[27]. The insight of this approach is that to achieve a match between a disadvantaged jobseeker and an employer, employment services providers should devote as much effort to working with the employer as improving the skills and motivation of the jobseeker. Government-backed programs that adopted the demand led approach include the ‘Ambition’ program in the United Kingdom and the Australian Employment Covenant[28].
A second emerging approach, referred to as ‘wrap-around servicing’, is to integrate traditional employment assistance with other support services such as mental health, social housing and family support services. The insight behind this approach is that these services are likely to be more effective when offered together than separately or in sequence. The integration of employment and mental health services in Individual Placement and Support (IPS) schemes has shown some promise in Australia[29]. Rather than treat mental illness first and then refer to employment, the IPS approach combines job referral and support in employment, either coordinated between mental health and employment service providers, or through employment counsellors attached to mental health clinics.
A suite of ‘wrap around service’ schemes for disadvantaged jobseekers was funded by the Australian Government in its ‘Building Australia’s Future Workforce’ initiative announced in the 2011 Budget[30]. Unfortunately detailed information on participation in these schemes and their effectiveness is not yet available so these are not discussed further in this paper.
For example, a Danish evaluation of the net impact of labour market programs for unemployment insurance clients found that impacts rose for the first 3 years of unemployment and then fell. See Danish Ministry of Employment (2000).[31]
Similarly, a net impact evaluation indicated that programs were more effective for Dutch unemployment insurance clients when implemented after one year of unemployment. See Tempelman C, et al (2010).
Key features of the Job Services Australia program
The principal employment services program for unemployed people is Job Services Australia (JSA), under which the Employment Department contracts out all employment assistance to for profit and not for profit providers who are paid according to a combination of service inputs, investment in work experience and training and other supports, and employment outcomes. This replaced the similarly-designed Job Network program in 2009.
Australia was among the pioneers of contracting out of public employment services to private providers and remains the only OECD country where the entire national network of employment services is contracted out[32]. The Job Network replaced the Commonwealth Employment Service and a range of national work experience and training programs for disadvantaged jobseekers from 1998. Employment services were tendered by the Employment Department every three years, offering providers a fixed share of ‘business’ (jobseeker referrals) within each ‘Employment Services Area’. Providers were paid a commencement fee per jobseeker and outcome fees for a range of specified employment and training outcomes, especially jobs lasting at least three months. On commencement of unemployment, each individual was assessed using a ‘Job Seeker Classification Instrument’ that estimated their risk of long-term unemployment. Their score, together with their duration of unemployment, determined the level of fees (especially outcome fees) paid to providers.
The idea behind this new system of outcomes based funding was that by giving jobseekers a choice of provider and by leaving the provider to decide the form of assistance offered to each jobseeker, assistance would be tailored to individual needs. There are similarities between this ‘black box’ contracting model and the new Work Program for long term unemployed people in the United Kingdom[33]. A significant innovation was the introduction of a five-tier ‘Star Ratings’ system to provide information for jobseekers and (more importantly, as it turned out) the Employment Department on the relative performance of providers. Unlike outcome payments, which were to a large extent a deadweight cost to the Government (since most employment outcomes would have been achieved without assistance) the Star Ratings were based on estimates of the net impact of employment services on people’s employment prospects – or the value-added by the service. The Star Ratings were used to award ‘business shares’ to better-performing providers[34].
In 2003, the Active Participation Model of the Job Network was introduced. The new model moved away from the ‘black box’ approach in response to concerns about ‘parking’ of jobseekers (provision of minimal or no service) and excessive profit-taking. Providers were contracted to offer jobseekers a fixed ‘continuum’ of service, with the highest payments reserved for the Customised Assistance stage which lasted for six months following the 12th or 24th month of unemployment (earlier if the jobseeker was assessed as disadvantaged). Customised Assistance combined a period of intensive job search assistance with activities such as training or work experience. To reduce parking and profit-taking, around one third of total funding was quarantined in a ‘Jobseeker Account’ for providers to invest in these and similar interventions to overcome barriers to employment.
Another key element of the Job Network service continuum was ‘Mutual Obligation’. For six months of each year of unemployment (alternating with periods of Customised Assistance), a jobseeker was expected to undertake six months of work related activity such as training, part time employment, or work for benefits. The default activity was ‘Work for the Dole’, a ‘work for benefits’ scheme offering six months’ work experience on projects of community benefit.
The Job Services Australia (JSA) program that commenced in 2009 retained the basic structure of the Job Network model, including
- Service payments to ensure regular interviews and supervision of activity requirements;
- An Employment Pathway Fund (EPF) to replace the Jobseeker Account;
- Outcome payments focussing on employment that is sustained for 3 to 6 months, with higher payments for long-term and more disadvantaged jobseekers;
- The performance management system based on Star ratings and regular (though less frequent) ‘business share re-allocations’ among providers.
The key changes included:
- Risk-based rather than duration-based targeting:
The ‘Job Seeker Classification Instrument’ and a disability assessment tool were used to divide participants into four ‘Streams’ of labour market disadvantage. People with substantial health and social barriers were shifted from a previous program (Personal Support Program) into mainstream employment services as ’Stream 4’ of JSA.
Higher service fees and EPF credits were targeted towards those in the higher Streams rather than long-term unemployment. After 12 months’ unemployment, a jobseeker entered a ‘Work Experience Phase’ which attracted lower payments for the provider than ‘Stream 3’ or ‘Stream 4’ jobseekers in the first year of unemployment. Resources were thus shifted from ‘curing’ long term unemployment towards ‘preventing’ it. - More flexible sequences of activation:
Providers were given more discretion to determine the form and timing of regular periods of intensive activation, in lieu of a fixed ‘service continuum’. - Greater encouragement of training:
Incentives for participation in vocational training were increased, both for jobseekers and providers, and new training programs were funded including for vocational education and training under a‘Productivity Places Program’ (PPP)[35]. Resources for some other programs including ‘Work for the Dole’ were reduced.
Table 1 shows levels of participation in each Stream and the Work Experience phase. It indicates that 27% of participants at September 2013 were in the Work Experience Phase for long-term unemployed people, and that 39% were assessed as highly disadvantaged in the labour market (Streams 3 and 4). These categories are not mutually exclusive as participants usually remain in their ‘streams’ when they enter the Work Experience Phase.
Table 1: Participation in Job Services Australia, at September 2013
| Stream | Number | Proportion |
| Stream 1 | 267,000 | 35% |
| Stream 2 | 193,000 | 25% |
| Stream 3 | 150,000 | 19% |
| Stream 4 | 156,000 | 20% |
| Work experience phase (also included in Streams) | 207,000 | 27% |
| Total | 770,000 | 100% |
Sources: Department of Employment (2014c). * In September 2013
What employment outcomes have been achieved by Job Services Australia participants?
Figure 4 shows trends in average employment outcomes three months after program participation for Job Network ‘Intensive Support’ participants (those unemployed for over 3 months) and all Job Services Australia participants, from the last three years of measured Job Network outcomes ( up to 2010) through to 2013.
Figure 4

Source: Department of Employment (2014b); ABS, Labour Force survey; Department of Employment (various years), Labour Market Assistance Outcomes.
Note: Employment outcomes three months after leaving the program.The last outcomes from Job Network were reported 12 months later in 2010.
Figure 4 indicates that average employment outcomes declined from 54% to 48% following the Global Financial Crisis (GFC), continued to decline after the introduction of JSA (the results of which were measured from 2010), and fell more sharply in 2012. In the absence of a net impact evaluation of JSA, it is hard to draw clear conclusions from these data on the relative effectiveness of the two programs[36]. The decline in 2012 corresponds with the start of a second three-year JSA contract period, a time when services are disrupted by agency closures and the transfer of jobseekers to new agencies. More significantly, both of these declines in program outcomes corresponded with sharp reductions in employment growth in 2009 and 2012, as shown on Figure 5.
Figure 5
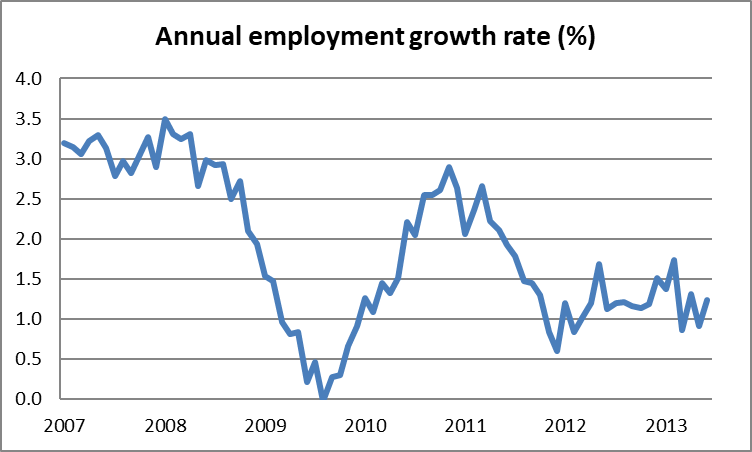
Source: ABS, Labour Force survey.
Is assistance for disadvantaged jobseekers appropriately targeted in Job Services Australia?
The JSA fee structure shifted resources from long-term unemployed people towards shorter-term unemployed people at risk of prolonged unemployment. Table 2 shows that the highest levels of service fees and EPF credits are paid in respect of ‘Stream 3’ and ‘Stream 4’ clients in their first year of unemployment. Once these jobseekers reach 12 months of unemployment they usually move into the Work Experience Phase, during which service fees are approximately halved and Employment Pathway Fund credits fall to around $500. In contrast, Customised Assistance, the highest level of Job Network assistance, was targeted towards long term unemployed people, though a minority of shorter-term unemployed people facing a high risk of long term unemployment were also targeted.
Table 2:
Comparison of the highest level of assistance in Job Network and Job Services Australia
| Job Network:
(Duration-based targeting) |
Job Services Australia: (Risk based targeting) |
|
| Highest level of assistance | Customised Assistance | Streams 3 & 4 |
| Duration
|
6 months | 12 months |
| Payments to providers in typical cases | Service fees of $600-$900 for fortnightly to monthly interviews
Plus $500-$900 in Jobseeker Account |
Service fees of $1,100-$1,900 for fortnightly to monthly interviews
Plus $1,100-$1,900 in Employment Pathway Fund |
| Targeted towards | Unemployed 12-18 months,
Unemployed 24-30 months, ‘Highly disadvantaged’ (high risk of LTU) in first 12 months) |
Those with disability/social barriers (Stream 4),
Others at high risk of LTU (Stream 3), in the first 12 months of unemployment |
Source: Davidson P & Whiteford P (2012).
Note: ‘LTU’ refers to long-term unemployment.
Figure 6 compares typical funding levels for providers in respect of Stream 3 jobseekers and recipients of Job Network Customised Assistance[37]. In the case of a typical Stream 3 jobseeker (one ‘at risk’ of long term unemployment), service fees and EPF credits are $600 lower for people unemployed for 1 to2 years than in the Job Network, reflecting the targeting of Job Network Customised Assistance towards long term unemployed people. They are also $1,000 less than funding levels for the same jobseekers in their first year of JSA assistance. For those unemployed for 2 to 3 years, JSA payments are higher due to an additional $1,100 credit to the EPF at that stage. However this is expected to fund a full 11 months of intensive employment-related activity for every remaining year of unemployment[38].
Figure 6:

Note: Based on typical cases, includes service fees and Jobseeker Account or Employment Pathway Fund credits.
Outcome payments and Star Ratings calculations are also heavily weighted towards Stream 3 and 4 clients. One fifth of the weights used for Star Ratings are for ‘full’ employment outcomes for Stream 3 and 4 clients respectively, compared with 6% for each of Streams 1 and 2 respectively. Outcome Payments for ‘full’ outcomes are also much higher for Stream 3 and 4 clients (typically $2,200 in the first year of unemployment for a ‘full’ employment outcome compared to $1,400 for Stream 2 and $400 for Stream 1).
Unlike service fees and EPF credits, outcome payments increase with unemployment duration (to around $3,100 after the second year of unemployment and $3,900 after the fifth year for Streams 3 and 4). However, outcome payments do not offer much reward for provider investment, even for the most disadvantaged jobseekers, as investments in labour market assistance have significant deadweight costs[39].
In the absence of a net impact study for JSA, one way to assess the efficacy of the shift from duration to a risk based targeting is to compare average ‘gross’ employment outcomes of Job Network and JSA clients by duration of unemployment.
Figure 7 compares employment outcomes for Job Network Intensive Support clients (those unemployed for at least 3 months) and JSA clients, by unemployment duration.
Figure7

Source: Department of Education, Employment and Workplace Relations(2008 &2011), Labour market assistance outcomes, years ending September 2008 and September 2011.
Note; ‘JN IS’ refers to the Intensive Support phase of Job Network, which commenced after 3 months’ unemployment.
‘% reduction’ is the difference between the 2008 and 2013 values, divided by the 2008 values.
Figure 7 shows that in 2013, employment outcomes following participation in JSA were 19% lower than in the Job Network in 2008[40]. Conclusions cannot be drawn from this about the relative effectiveness of the two programs since as noted previously, the fall in outcomes is probably mainly due to business cycle effects.
More salient are the relative employment outcomes at different stages of the unemployment spell. While average outcomes were 19% lower for JSA as a whole, the reduction in outcomes for short term unemployed people was 13% while the reduction for people unemployed for 1 to 2 years was 26%. Interestingly, the reduction in employment outcomes was slightly less for those unemployed for two to three years (25%), the stage of the unemployment spell where funding of JSA services increases (figure 6).
These changes in relative employment outcomes could be due to the changes in program design and targeting described above, or to changes in labour market conditions which disproportionately affected long term unemployed people. Regardless of the reason,these results raise serious concerns about the reduction in investment in long term unemployed people. There is a growing risk that people will become ‘stuck’ in long term unemployment, especially since over half of participants in the Work Experience Phase of the JSA program (that is, over 100,000 people) have been on income support for over three years and the graph indicates that outcomes for that group are 41% less than they were five years ago[41].
The answer to our second question: Are resources in the JSA system effectively targeted to assist long term unemployed people? is‘no’.
One option to improve target efficiency would be to raise the level of service payments and EPF credits for those unemployed over 12 months to the same level as applies to ‘Stream 3’ jobseekers in their first year of unemployment. This would broadly equalise support for those at risk of long term unemployment and those already unemployed long term. Since a majority of long term unemployed people come from Streams 3 and 4, this would not create an incentive for providers to delay employment outcomes until people are unemployed for 12 months in order to receive higher payments.
Does the JSA system encourage efficient investment in work experience and training?
Since the introduction of the Job Network, there have been few national work experience and training programs targeted to unemployed people apart from the ‘Work for the Dole’ program which provides up to three months of unpaid work experience on projects of community benefit.
The reason for this is that it was considered more efficient for employment service providers to decide which forms of work experience or training are best suited for each jobseeker[42]. In the Job Network and subsequent employment service purchasing models, the main levers available to policy makers to encourage and support efficient investment in work experience and training are outcome payments, Star Ratings, and notional ‘investment funds’ such as the Jobseeker Account or Employment Pathway Fund.
Investment incentives in the employment services system
While on the face of it providers are rewarded for employment outcomes regardless of how they are achieved, Australia’s employment services system has always encouraged some interventions and discouraged others. Broadly speaking, funding to short term outcomes encourages providers to focus on relatively inexpensive forms of job search assistance and to avoid investment in longer term and more costly activities such as paid work experience and substantial vocational training courses that might delay employment outcomes[43]. The introduction of the Jobseeker Account (now Employment Pathway Fund) was partly intended to compensate for this bias against patient investment in work experience and training[44].
The employment services system during the Job Network period (1998 to 2008) favoured‘work for benefits’ schemes since Work for the Dole was the default program for regular Mutual Obligation activities and it was one of few work experience and training programs that was separately funded[45]. There was also a bias against vocational training since jobseekers were not generally permitted to undertake courses of more than 12 months’duration while on unemployment payments, and under the prevailing ‘work first’ policies, providers were discouraged from approving part-time courses of more than a few months’ duration[46].
The JSA system reversed the previous bias in favour of ‘work for benefits’ and against training. Work for the Dole was no longer funded as a separate program, so JSA providers had to use EPF credits or their ‘own’ funds to finance such placements. This was intended to encourage cost-efficient investment in unpaid work experience by bringing it within the scope of the outcomes-based system of employment services purchasing[47].
The removal of specific funding for ‘work for benefits’ programs encouraged greater use of training to fulfil requirements for providers to organise compulsory periods of intensive work-related activity during the Work Experience Phase. Vocational training courses were generally a cheaper option for providers, to the extent that they could refer people to free or low cost training in the State Government- run Vocational Education and Training (VET) system. Commonwealth funding for the VET system was also boosted through a ‘Productivity Places Program’ in which half the places were reserved for unemployed people. Significantly, under an ‘Earn or Learn’ policy announced in 2009, young people under 21 years who had not completed 12 years of schooling (‘early school leavers’) were required to participate in education or training instead of actively seeking employment until they achieved an equivalent qualification to 12 years of schooling[48]. Further, parents and carers were no longer required to abandon part time training courses if they prevented them from taking up an employment offer[49].
Data on investment in wage subsidies and training by employment service providers
Table 3 compares average provider investments in training and wage subsidies (paid work experience) activities undertaken by Job Network and JSA providers using the Jobseeker Account and EPF, respectively. These data do not include places in programs that were funded separately, such as Work for the Dole which is discussed separately below.
Table 3: Comparison of Job Seeker Account and Employment Pathway Fund expenditures for long-term unemployed people (2003-2011)
| Number or % of jobseekers that received assistance | Average cost of assistance | % of all Jobseeker Account/EPF expenditure2. | |
| Job Network Customised Assistance (2003-06) | |||
| Training.1. | 25% | $350 | 23% |
| Wage subsidies | 12% | $2,590 | 23% |
| Job Services Australia (2009-11) | |||
| Training . | 44,000 3. | $303 | 33% |
| Wage subsidies | 13,000 3. | $2,050 | 21% |
Sources: Department of Employment and Workplace Relations(2006); Department of Education, Employment and Workplace Relations(2012); Department of Education, Employment and Workplace Relations(2011).
1. Includes training in job search skills but not the Job Search Training courses offered earlier in the APM continuum.
2.Other expenditures (each of which attracted lower shares of total credits) included clothes and equipment, fares and petrol, interpreters, additional provider contacts, professional services, and relocation assistance.
3. Number of exits from these activities in the JSA ‘Work Experience Phase’ for Year ending September 2011. This is not expressed in the LMAO report as a percentage of all Work Experience Phase participants.
A comparison of the unit and total costs of training and wage subsidy places purchased by providers suggests that the number of training places purchased exceeded the number of wage subsidies by a factor of seven to one under the Job Network and a factor of ten to one under JSA[50]. However, the training was purchased at a very low average cost ($300 to $350) indicating that it was either very short-term nature or that providers referred jobseekers to State Government-funded vocational education and training places.
These data do not include separately-funded places under national wage subsidy schemes (paid work experience) or Work for the Dole (unpaid work experience). Table 4 shows that these wage subsidy scheme places(which are separate to those funded by providers in table 3) rose from up to 3,000 per year under the ‘Wage Assist’ program in 2007 to 10,000 a year from 2011 under the more recent ‘Wage Connect’ scheme[51].Nevertheless, the overall use of wage subsidies remained low (and much lower than the use of training) under both the Job Network and JSA regimes.Work for the Dole places were more widely available in the Job Network era, with 65,000 participants overall in 2007-08. Places in that program fell considerably in the JSA era – to 28,000 in 2010-11.
Table 4: Separately-funded paid and unpaid work experience places
| Job Network period (2007): |
Job Services Australiaperiod (2011) | |
| Wage subsidy schemes | 3,000 | 10,000 |
| Work for the Dole | 65,000 | 28,000 |
Sources: Department of Education Employment and Workplace Relations (2008b) Australian Government (2011) Department of Education, Employment and Workplace Relations (2007 and 2011), Labour market assistance outcomes, Canberra.
Another source of data on investment in work experience and training is the OECD’s social expenditure data base, though this only extends to 2011, the first two years of JSA (figure 7). In 2009, overall investment in labour market assistance for unemployed people in Australia was relatively low, at about half the OECD average (0.3% of GDP compared with 0.6%)[52]. Of these funds, most were devoted to ‘placement and related services’ (comprising assessment, job matching, and employment counselling but also includes expenditure by JSA providers in work experience and training using the EPF). Since the beginning of the Job Network, direct Government outlays on work experience and training programs for unemployed people have been very low by OECD standards. Expenditure on the Work for the Dole program (the main component of the ‘direct job creation’ category since 1998)fell, and direct Government spending on training for unemployed people rose,with the introduction of JSA in 2009.
Figure 7

Source: Organisation for Economic Cooperation and Development (2014).
Note: Prior to 2001, expenditure on placement and related services was not recorded. After 2001, this head of expenditure includes training and work experience purchased using the Jobseeker Account/EPF. ‘Direct job creation’ refers mainly to and the Work for the Dole program and its equivalent for Indigenous people, the Community Development Employment Program (CDEP).
To summarise, since the introduction of the Job Network, Australian employment assistance programs have been heavily weighted towards low-cost job search assistance. The introduction of JSA saw a shift within our relatively modest investment in work experience and training from work for benefits schemes towards vocational training, which was mainly of a short-term nature.
The effects of the changed profile of investment in work experience and training in the JSA program
Table 5 compares employment outcomes from various activities undertaken by long term unemployed people in the Work Experience Phase of JSA in 2013.
Table 5: Outcomes of employment assistance(year ending September 2013)
| Activity
|
% employed 3 months after completion |
| Wage subsidy | 471 |
| Training | 30 |
| Work for the Dole | 23 |
| Total | 28 |
Source: Department of Education, Employment and Workplace Relations (2013), Labour market assistance outcomes, year ended September 2013 – Job Services Australia; Department of Education, Employment and Workplace Relations (2013).
1. Year to February 2013, % employed 6 months after completion.
On the face of it these data suggest that wage subsidies are much more effective than either training or ‘work for benefits’ programs. However, they show ‘gross’ not ‘net’ employment impacts and therefore do not take account of differences in the characteristics of participants. For example, only one in three of those receiving wage subsidies in 2013 were long-term unemployed. Only one net impact study of labour market assistance was undertaken since the introduction of JSA in 2009. This assessed the impact of expenditure of EPF funds on wage subsidies on the probability of being off income support 12 months after commencement of the placement, which was estimated to be 14 percentage points[53].
To assess the relative effectiveness of different interventions in the absence of a more comprehensive net impact study,we rely on the international (and previous Australian) evidence presented earlier.
Well targeted wage subsidy schemes are generally considered effective. The introduction of a separate wage subsidy scheme in 2012 (Wage Connect) suggests that policy makers believed that the JSA payment structure did not of itself encourage an optimal level of investment in wage subsidies (for example, only 11,000 in the year ending September 2011 – see table 3).Wage Connect was consistently over-subscribed, which suggests that there was more than enough employer demand for places. However, the scheme was capped at only 10,000 places per year so would have made little impact on the overall unemployment level.
The data cited in the previous section show that participation levels in vocational training rose substantially following the introduction of JSA, but that most of the training was either in very short courses,or it was funded from sources outside the JSA program[54]. Little is known publicly about the nature of the courses offered and qualifications obtained, or employment outcomes following participation[55]. Given the evidence presented previously on the poor results from short vocational training courses, and the low level of investment in training by providers, the increased use of training was not likely to significantly improve employment outcomes.
In regard to work for benefit schemes, it is clear that participation in Work for the Dole fell substantially with the introduction of the JSA regime. If those resources were redirected towards more effective interventions, such as wage subsidies or more substantial training, then the reduction in investment in work for benefits schemes was likely to improve employment outcomes. However this does not seem to have happened.
Overall public funding for employment services declined with the introduction of JSA[56], and funding levels have not increased substantially (through indexation or otherwise) over the past six years.
As noted previously, evaluations point to the importance of individualised help for the most disadvantaged jobseekers. This suggests that average caseloads, and the degree of discretion given to Employment Consultants to offer long term unemployed people the most appropriate help for their needs and local labour market conditions, are key predictors of the likely effectiveness of JSA. In 2012, the average caseload for a JSA consultant was 114, which was similar to caseloads in the Job Network era[57].This makes it very difficult for providers to offer individualised help to more than a small minority of jobseekers assisted[58]. In a major survey of employment consultants, 72% indicated that: ‘the IT system dictates how I do my job’[59].
In the absence of up to date evaluation studies, the answer to the third research question: Does the JSA system encourage efficient investment in work experience, training and other supports needed by long term unemployed people? is less conclusive than the other two questions.
While the JSA model is more flexible than the Job Network (especially with the removal of the rigid ‘service continuum’), employment consultants lack the resources and the time to offer an individualised service to their (average of) 114 clients. It is likely that cost considerations and the availability of externally funded program places (especially in the VET system) had a large influence on their decisions to refer jobseekers to programs. The survey cited previously indicates that 31% of consultants considered that the ‘availability of program places’ was a key influence in this decision making process[60].
The limited use of relatively effective programs, such as wage subsidies and more substantial or individually-tailored training programs, suggests that provider investment in long term unemployed people in the JSA era was no more effective on average than in the Job Network era, and may be less so given the shift of program resources from long term unemployed people to those at risk of long term unemployment.
Conclusions
As unemployment rates have fallen over the last 20 years, the profile of unemployed people receiving income support has become more disadvantaged. Two thirds of Newstart Allowance recipients have received income support for over a year, and half for over two years. High levels of long term unemployment entrench poverty and structural unemployment.
The labour market ‘activation’ of unemployed people can reduce long term unemployment by requiring people with reasonable good job prospects to search for employment more intensively and effectively. Activation on its own is not sufficient. People who are unemployed long term or at risk of it usually face hurdles to employment such as low skills, a lack of work experience, or disabilities. Employment programs such as vocational training and paid and unpaid work experience are designed to help people overcome these and other barriers to employment.
Broadly speaking, among these programs paid work experience (using wage subsidies) in regular jobs and substantial vocational training (preferably linked to a job) are relatively effective while very short training courses (less than three months) and ‘make work’ schemes, whether paid or unpaid are relatively ineffective. That said, the international evidence suggests that successful interventions are generally those which are tailored to the individual needs of jobseekers and employers, rather than standardised. This suggests that the caseloads and degree of discretion exercised by Employment Consultants are critical factors.
Over the last two decades, some Governments including Australia’shave moved away from funding work experience and training programs directly and towards paying contracted employment service providers according to the outcomes they achieve. This principle underpinned the Job Network and its successor program, JSA.
Yet competition among providers and funding to outcomes are not‘silver bullets’ to reduce long term unemployment. If providers are rewarded for short term results and funding levels are low, they have little incentive to undertake patient investment in programs to help overcome people’s barriers to work and tend to focus on low-cost job search assistance methods. To overcome this problem, and the associated problem of ‘parking’, around one third of the resources in both the Job Network and JSA programs were quarantined for investment in such activities as work experience and training, generally during periods of compulsory ‘intensive activation’.
The main changes introduced when the JSA model replaced the Job Network included a shift in resources from intensive support for long term unemployed people towards assistance for those at risk of it. Evaluation data suggests that this is not an optimal use of resources, since intensive employment assistance has its greatest impact, on average, once a jobseeker is unemployed for one to three years. Since the introduction of JSA, employment outcomes for long term unemployed people have declined sharply relative to those unemployed for less than a year. The diversion of resources away from long term unemployed people (who typically receive an interview every two months plus $500 worth of further assistance) has probably contributed to this result. There is a strong case for targeting more resources towards people unemployed long term, by funding providers to offer at least the same level of support to people who are long term unemployed as those at risk of it.
Overall levels of public funding for employment assistance for unemployed people in Australia are low by OECD standards and concentrated on low-cost job search assistance and activation. Within the envelope of our very modest additional expenditure on work experience and training, the JSA model shifted investment away from work for benefits (Work for the Dole) towards vocational training. Shifting resources away from work for benefits is probably cost effective as the unit cost of Work for the Dole was over$2,000 and the impact of ‘work for benefits’ programs on the job prospects of participants is very limited. However, the same can be said of the short training courses to which these resources were diverted in the JSA model. The modest boost to wage subsidies for long term unemployed people is likely to be cost effective, but only 10,000 places have been allocated annually despite strong employer demand. There is a strong case for higher investment in wage subsidies for people unemployed long-term.
In response to provider concerns about ‘red tape’ and excessive control of their work by the Employment Department, the JSA model loosened those controls to a degree. It gave providers more latitude to determine the nature and timing of periods of intensive activation and assistance for disadvantaged jobseekers. However, this was unlikely to lead to genuine ‘individualisation’ of employment services, or improved employment outcomes, while average employment consultant caseloads remained at over 100 jobseekers. A substantial increase in provider service fees for people unemployed long term as suggested above is needed to reduce caseloads to make room for individualised assistance.
In the absence of net impact evaluations, we do not know whether the JSA model is more effective in assisting disadvantaged jobseekers. The limited evidence available from Australian and international evaluations suggests that it is unlikely to be substantially more or less effective than the Job Network for the average participant, but that outcomes for people at risk of long term unemployment have probably improved at the expense of those already in that situation.
When it comes to employment services, as in other fields of public policy, Governments achieve the outcomes they are prepared to pay for.
References
| Anderson T et al (2004), Work-Based Learning for Adults: an evaluation of labour market
effects commissioned by the Department for Work and Pensions, London: National Centre for Social Research. |
| Australian Bureau of Statistics (various years), Labour Force survey, Canberra |
| Australian Council of Social Service (2006), The role of education and training in Welfare to Work policies, Sydney Australian Council of Social Service. |
| Australian Council of Social Service (2012), Submission to Senate Inquiry into the Adequacy of Allowance payments, Sydney:Australian Council of Social Service. |
| Australian Council of Social Service, Business Council of Australia, and Australian Council of Trade Unions (2014), Partnerships to assist disadvantaged jobseekers into secure jobs, Melbourne. |
| Australian Government (2008), Budget Paper No 2, Budget Papers, Canberra. |
| Australian Government (2009), Budget measures, Budget Papers, Canberra. |
| Australian Government (2011), Building Australia’s Future Workforce, Budget Papers, Canberra. |
| Baker A (2013), Not Looking for Work: The Rise of Non-Jobseekers on Unemployment Benefits, Sydney:Centre for Independent Studies. |
| Bivand, P (2006). Evaluation of StepUp pilot, final report. London:Department for Work and Pensions. |
| Borland J, & Wilkins R (2003), Effects of activity tests on exit from payments – the 9 months intensive interview, , Melbourne: Melbourne Institute Working Papers 25/03. |
| Bowman D &Lawlor J (2010), Evidence and experience: Report on the Individual Placement and Support project for disadvantaged job seekers with mental health issues, Melbourne:Brotherhood of St Laurence. |
| Bredgaard T & Larsen F (2005). Contracting out the public employment service, a quasi market analysis. Transitions and risk, new directions in social policy. Melbourne:Centre for Public Policy, University of Melbourne. |
| Breunig R et al (2003), Assisting the long-term unemployed: Results from a randomized trial, Economic Record, Vol 79. |
| Brock T et al (1994), Unpaid work experience, for welfare recipients, Findings and Lessons from MDRC Research,Washington:Manpower Development Research Corporation. |
| Card D, et al (2009), Active labour market policy evaluations, a meta analysis, IZA Discussion Paper No 4002, Bonn: Institute for the Study of Labor. |
| Considine M (2001), Enterprising states, Cambridge:Cambridge University Press. |
| Considine M et al (2012), Increasing Innovation and Flexibility in Social Service Delivery Australian Report back to Industry Partners, Melbourne: School of Social and Political Sciences University of Melbourne. |
| Danish Ministry of Employment (2000), More People at Work, Analysis Paper 6, Effects of activation measures, Copenhagen, at: |
| Davidson P and Whiteford P (2012), Overview of Australia’s system of income and employment assistance for the unemployed, Paris:OECD Social Employment and Migration Working Paper No 129 |
| Department for Work and Pensions (2012), Early impacts of Mandatory Work Activity, London: Department for Work and Pensions. |
| Department for Work and Pensions (2013), Support for the very long term unemployed trailblazer longer term analysis of benefit impacts, London:Department for Work and Pensions. |
| Department of Education, Employment and Workplace Relations (2008a), Portfolio Budget Statement, Budget Papers, Canberra. |
| Department of Education, Employment and Workplace Relations (2008b), Welfare to Work Evaluation Report, Canberra. |
| Department of Education, Employment and Workplace Relations (2010), Labour market assistance, a net impact study, Canberra. |
| Department of Education, Employment and Workplace Relations (2011), Labour Market Assistance Outcomes, Year ending June 2011, Canberra. |
| Department of Education, Employment and Workplace Relations (2012a), Employment Pathway Fund evaluation: wage subsidies, Canberra. |
| Department of Education, Employment and Workplace Relations (2012b), Labour Market Assistance Outcomes, Year ending June 2011, Canberra. |
| Department of Education, Employment and Workplace Relations (2012c), Employment Pathway Fund evaluation, Canberra. |
| Department of Education, Employment and Workplace Relations (2012d), Submission to Senate Inquiry into the Adequacy of Allowance payment, Canberra. |
| Department of Education, Employment and Workplace Relations (2013), Response to Senate Education Employment and Workplace Relations Committee, Question on Notice EW0868_13, Canberra. |
| Department of Education, Employment and Workplace Relations (2014), Response to Senate Standing Committee on Education and Employment, Question on Notice EM0094_14, Canberra. |
| Department of Employment (2014a), Response to Senate Employment and Workplace Relations Committee Question No EM0094_14 |
| Department of Employment (2014b), Response to Senate Estimates Question NoEM0172_14. |
| Department of Employment (2014c), Response to Senate Standing Committee on Education and Employment, Question on Notice EM0948_11, Canberra. |
| Department of Employment (2014d), Response to Senate Standing Committee on Education and Employment, Question on Notice EM0093_14, Canberra. |
| Department of Employment (2014e), Response to Senate Standing Committee on Education and Employment, Question on Notice EM0098_14, Canberra. |
| Department of Employment and Workplace Relations (2002a), Active Participation Model, Budget Papers, Canberra. |
| Department of Employment and Workplace Relations (2002b), Evaluation of the Job Network, stage 3 effectiveness report,Canberra |
| Department of Employment and Workplace Relations (2006), Jobseeker account evaluation, Canberra. |
| Department of Social Services (2014), Statistical summary of social security payments, Canberra. |
| Finn D and Schulte B (2008), Employment first, activating the British Welfare State, in Eichhorst W, et al, Bringing the jobless into work? , Berlin:Springer. |
| Fowkes L (2011), Rethinking Australia’s employment services, Sydney:Whitlam Institute |
| Freud D (2007), Reducing dependency, increasing opportunity, London: Department for Work and Pensions. |
| Goul Andersen J and Pedersen J (2006), Continuity and change in Danish active labour market policy 1990-2007, Centre for Comparative Welfare Studies Working Paper no. 2007-54, Aalborg: Department of Economics, Politics and Public Administration, Aalborg University |
| Graversen B and Jensen P (2006), A reappraisal of the virtues of private sector employment programmes, IZA Discussion Papers No. 2230, Bonn: Institute for the Study of Labor. |
| Graversen B and Van Ours J (2008), How to Help Unemployed Find Jobs Quickly: Experimental Evidence from a Mandatory Activation Programme, Journal of Public Economics, 92:2020-2035. |
| Hasluck C and Green A 2007, What works for whom? Leeds:Department for Work and Pensions Research Report No 407. |
| Heckman J, et al (1999), The Economics and Econometrics of Active Labor Market Programs, in Ashenfelter O and Card D, Handbook of Labor Economics 3:1865–2097, Amsterdam:Elsevier. |
| Hotz V et al (2004), The long term gains from GAIN, NBER Working Papers No 807, Cambridge MA:National Bureau of Economic Research. |
| Jespersen S, et al (2004). Costs and benefits of Danish active labour market programs. Working paper No1. Copenhagen: Danish Economic Council. |
| Johri R, et al (2004), Evidence to date on the working and effectiveness of ALMPs in New Zealand’ Wellington:New Zealand Department of Labour and Ministry for Social Development. |
| Kalisch D (1991), Long term UB recipients, the impact of Newstart and economic conditions, National Social Policy Conference, Sydney: July 1991. |
| Killackey E, et al (2008), Vocational intervention in first-episode psychosis: individual placement and support v. treatment as usual, The British Journal of Psychiatry 193:114–120. |
| Machin S and Manning A (1999), The causes and consequences of longterm unemployment in Europe. in Ashenfelter O and Card D,Handbook of Labor Economics, Paris: Elsevier. |
| Martin J and Grubb D (2000), What works among active labour market policies, OECD Economic Studies 30:1, pp79-113, Paris:Organisation for Economic Cooperation and Development. |
| Meagher N (2009), The Role of Training and Skills Development in Active Labour Market Policies, International Journal of Training and Development 13:1, Malden MA:Wiley‐Blackwell. |
| O’Connor B (2009), Improved participation requirements for parents and carers, Media Statement, Canberra: Minister for Employment Participation. |
| Organisation for Economic Cooperation and Development (2001), Innovation in labour market policies, the Australian way, Paris:Organisation for Economic Cooperation and Development. |
| Organisation for Economic Cooperation and Development (2005), Employment Outlook, Paris:Organisation for Economic Cooperation and Development |
| Organisation for Economic Cooperation and Development (2012), Activating jobseekers, how Australia does it. Paris:Organisation for Economic Cooperation and Development |
| Organisation for Economic Cooperation and Development (2014), Social expenditure data base |
| Productivity Commission (2002), Report of the independent review of the Job Network, Canberra:Productivity Commission. |
| Saunders P. and Taylor R (2002), The price of prosperity : the economic and social costs of unemployment. Sydney: University of New South Wales Press. |
| Tempelman C, et al (2010), Cost benefit analysis of reintegration, Report commissioned by the Ministry of Employment and Social Affairs, Amsterdam:SEO. |
| Van Reenen J (2003), .Active labour market policies and the British New Deal for Young people in context. Cambridge MA :National Bureau of Economic Research Working Paper No. 9576. |
| Vanstone A (1996), Reforming employment assistance, Canberra:Department of Employment, Education Training and Youth Affairs. |
| Wells W (2001), From Restart to the New Deal in the UK, in Organisation for Economic Cooperation and Development (2001), Labour market policies and the public employment service, Paris. |
| Wren T (2012), Demand-led workforce strategies, presentation to Australian Council of Social Service conference, Melbourne: March 2012. |
Notes
[1]Department of Education, Employment and Workplace Relations (2012a).
[2]Short courses costing less than $1,000 might include ‘responsible service of alcohol’ courses necessary for people to work as bartenders.The Government funded an additional 180,000 vocational education and training (VET) places in 2010-11 under its ‘Productivity Places Program’, of which about half were earmarked for unemployed people. However, the LMAO data indicate that of 181,000 JSA activities in 2010-11 that comprised training courses, only 20,000 were financed under the Productivity Places Program. OECD (2013); Department of Education, Employment and Workplace Relations (2012), Labour Market Assistance Outcomes, Year ending June 2011, Canberra.
[3]For a detailed discussion of the poor state of data on participation in and outcomes from training by jobseekers, see OECD (2012), op cit.
[4]Australian Government (2008).
[5]Considine M (2001).
[6]Fowkes L (2011).
[7]Considine M et al (2013).
[8]Considine M et al (2012).
[9]Organisation for Economic Cooperation and Development (2014).
[10] Table 5 indicates that the overall share of Jobseeker Account/EPF credits invested in training rose substantially from 23% to 33% while the share devoted to wage subsidies remained stable at around 22%.
[11]Department of Education Employment and Workplace Relations (2010b); Australian Government (2011).
[12]As a proportion of outcomes achieved in 2008.
[13]In September 2013.See Department of Employment(2014a).
[14] Vanstone A (1996).
[15]Bredgaard T and Larsen F (2005); Department of Employment and Workplace Relations (2002b); Productivity Commission (2002).
[16]Department of Employment and Workplace Relations (2002a).
[17]The Government funded Community Work Coordinators to establish work experience placements and projects, and connect Job Network participants with them, at an average unit cost of around $2,000.
[18]Australian Council of Social Service (2006).
[19] The OECD reported that providers did not consider they can fund Work for the Dole places at their previous level using EPF credits. See OECD 2012, op cit.
[20]Australian Government (2009); Baker A (2013).
[21] O’Connor B 2009.
[22]If employment assistance increases the probability of payable outcomes by 10%, the reward for provider investment that results in a ‘full outcome’ for a person unemployed for 5 years would average $3,900 X 10% or about $400 per head.
[23] Stream 3 clients are assessed as facing a high risk of long term unemployment. Outcome payments are not included in these calculations due to a lack of publicly available data on typical employment outcomes achieved.
[24]Australian Government (2011).
[25] Their client populations are different. Figure 4 excludes the least disadvantaged Job Network participants (those unemployed for less than 3 months) but the results for JSA include a relatively disadvantaged group (Stream 4 participants) who were excluded from the Job Network as most were referred instead to the PSP program.
[26] For a more detailed history of the employment services system since the 1990s, see Davidson P & Whiteford P (2012); OECD (2001); OECD (2012).
[27]Vanstone A (1996).
[28]Productivity Commission (2002). Star Ratings were developed using regressions to compare actual employment outcomes with predicted outcomes based on individual characteristics.
[29]OECD (2012), op cit
[30]Card D, et al (2009).
[31]For an influential argument for such investment on narrower cost-benefit grounds, see Freud D (2007).
[32]Graversen B& Van Ours J (2008); Wells W (2001).
[33]Kalisch D (1991); Department of Education, Employment and Workplace Relations(2008b).
[34] Borland J,&Wilkins R (2003).
[35]Borland J & Tseng T (2003).
[36]Breunig R et al (2003).
[37]Van Reenen J (2003).
[38]Hasluck C and Green A (2007).
[39]Goul Andersen J and Pedersen J (2006); Finn D and Schulte B (2008).
[40]Hasluck C and Green A (2007).
[41]For good summaries of international evaluation studies see: Card D,et al (2009); Martin J and Grubb D (2000) and Hasluck C and Green A (2007).
[42]Jespersen S, et al (2004); Graversen B and Jensen P (2006).
[43]; OECD (2005); Bivand, P (2006).
[44]Johri R, et al (2004); Department for Work and Pensions (2012); Department for Work and Pensions (2013);Brock T et al (1994).
[45]Meagher N (2009); Hotz V et al (2004); Anderson T et al (2004).
[46]Australian Council of Social Service, Business Council of Australia, and Australian Council of Trade Unions (2014).
[47]Wren T (2012).
[48]Bowman D &Lawlor J (2010); Killackey E, et al (2008).
[49]Australian Government (2011).
[50]Department of Education, Employment and Workplace Relations(2012), op cit.
[51]Heckman J, et al (1999).
[52]Details of the Job Network and Customised Assistance are provided in a later section of this paper. Customised Assistance was offered to short term unemployed people assessed as ‘at risk’ of long term unemployment, and to people already unemployed for one to three years.
[53] This is a different statistic to long term unemployment as measured in labour force surveys. Some unemployment payment recipients are not classified as unemployed (e.g. because they are undertaking training) while some long term unemployed people are not eligible for income support (e.g. due to their partners earnings).
[54]Department of Employment (2014d).
[55]Machin S and Manning A (1999); Saunders P. and Taylor R (2002).
[56]Department of Education, Employment and Workplace Relations(2012d); Australian Council of Social Service(2012).
[57]Department of Employment (2014e).
[58]Australian Bureau of Statistics(various years), Labour Force survey, Canberra.

Nicce blog
LikeLike